22 Johnson Place Wakefield, RI 02879
Estimated Value: $510,964 - $587,000
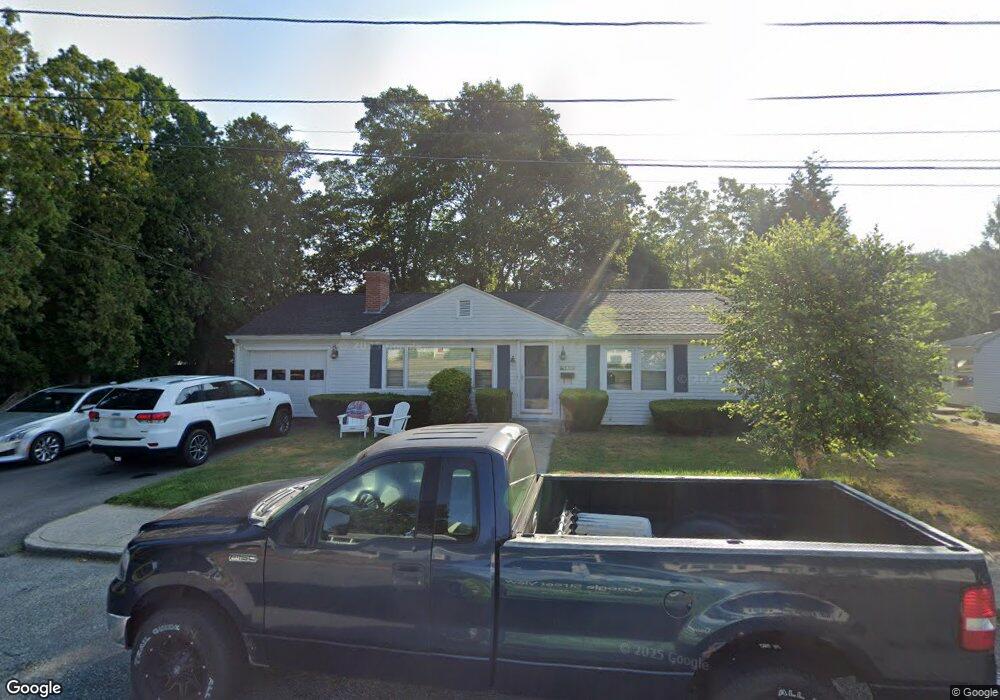
About This Home
This home is located at 22 Johnson Place, Wakefield, RI 02879 and is currently estimated at $553,991, approximately $524 per square foot. 22 Johnson Place is a home located in Washington County with nearby schools including South Kingstown High School, Monsignor Matthew Clarke Catholic Regional School, and South Shore School.
Ownership History
We collect this data history from publicly available records. To have your information removed, we recommend requesting removal directly through your county’s website.
Purchase Details
Home Financials for this Owner
Home Financials are based on the most recent Mortgage that was taken out on this home.Home Values in the Area
Average Home Value in this Area
Purchase History
We collect this data history from publicly available records. To have your information removed, we recommend requesting removal directly through your county’s website.
| Date | Buyer | Sale Price | Title Company |
|---|---|---|---|
| $240,500 | -- |
Mortgage History
We collect this data history from publicly available records. To have your information removed, we recommend requesting removal directly through your county’s website.
| Date | Status | Borrower | Loan Amount |
|---|---|---|---|
| Open | $207,900 | ||
| Closed | $236,831 | ||
| Closed | $236,201 |
Tax History
We collect this data history from publicly available records. To have your information removed, we recommend requesting removal directly through your county’s website.
| Year | Tax Paid | Tax Assessment Tax Assessment Total Assessment is a certain percentage of the fair market value that is determined by local assessors to be the total taxable value of land and additions on the property. | Land | Improvement |
|---|---|---|---|---|
| 2025 | $3,908 | $437,100 | $213,900 | $223,200 |
| 2024 | $3,500 | $316,700 | $164,500 | $152,200 |
| 2023 | $3,500 | $316,700 | $164,500 | $152,200 |
| 2022 | $3,468 | $316,700 | $164,500 | $152,200 |
| 2021 | $3,429 | $237,300 | $126,500 | $110,800 |
| 2020 | $3,429 | $237,300 | $126,500 | $110,800 |
| 2019 | $3,429 | $237,300 | $126,500 | $110,800 |
| 2018 | $3,393 | $216,400 | $121,000 | $95,400 |
| 2017 | $3,313 | $216,400 | $121,000 | $95,400 |
| 2016 | $3,265 | $216,400 | $121,000 | $95,400 |
| 2015 | $3,183 | $205,100 | $110,000 | $95,100 |
| 2014 | $3,175 | $205,100 | $110,000 | $95,100 |
Map
- 35 Highland Ave
- 302 Pond St
- 71 Kenyon Ave
- 216 Spartina Cove Way
- 23 Rockland Dr
- 10 Hendricks St
- 39 Hazard Ave
- 27 Shadow Farm Way
- 47 Tuckertown Rd
- 272 Pine Hill Rd
- 125 Woodruff Ave
- 102 Woodbine Rd
- 11 Billington Ave
- 124 Oak St
- 40 Tern Rd
- 435 Allen Ave
- 228 Rodman St
- 4 Sandy Bottom Shores Dr
- 24 Tern Rd
- 61 Broad Rock Rd
- 52 Johnson Place
- 38 Johnson Place
- 49 Johnson Place
- 51 Johnson Place
- 43 Johnson Place
- 243 Silver Lake Ave
- 30 Johnson Place
- 53 Johnson Place
- 35 Johnson Place
- 253 Silver Lake Ave
- 25 Johnson Place
- 44 Pond St
- 263 Silver Lake Ave
- 62 Pond St
- 211 Silver Lake Ave
- 36 Pond St
- 21 Johnson Place
- 215 Silver Lake Ave
- 30 Pond St
- 484 Main St
Ask me questions while you tour the home.