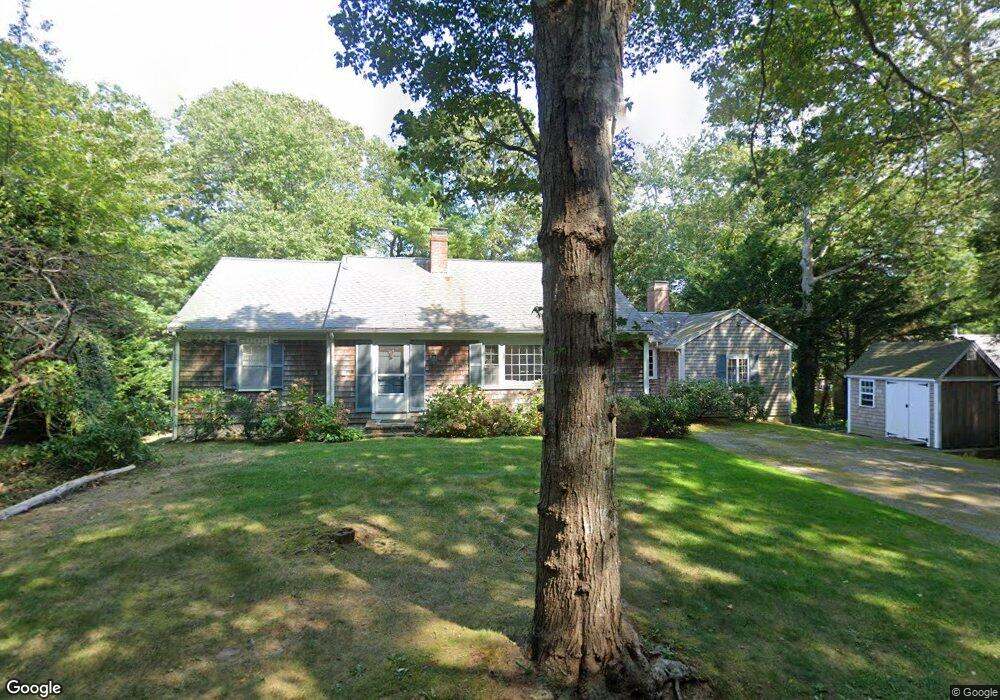
22 Linden Ln Osterville, MA 02655
Osterville NeighborhoodEstimated Value: $924,000 - $1,111,000
4
Beds
2
Baths
2,330
Sq Ft
$427/Sq Ft
Est. Value
About This Home
This home is located at 22 Linden Ln, Osterville, MA 02655 and is currently estimated at $994,681, approximately $426 per square foot. 22 Linden Ln is a home located in Barnstable County with nearby schools including Barnstable United Elementary School, West Villages Elementary School, and Barnstable Intermediate School.
Ownership History
Date
Name
Owned For
Owner Type
Purchase Details
Closed on
Jul 16, 2010
Sold by
Orbison Edith J
Bought by
Sullivan Kevin C
Current Estimated Value
Home Financials for this Owner
Home Financials are based on the most recent Mortgage that was taken out on this home.
Original Mortgage
$260,000
Interest Rate
4.82%
Mortgage Type
Purchase Money Mortgage
Purchase Details
Closed on
Jun 12, 1989
Sold by
Mason Barbara E
Bought by
Orbison Edith J
Create a Home Valuation Report for This Property
The Home Valuation Report is an in-depth analysis detailing your home's value as well as a comparison with similar homes in the area
Home Values in the Area
Average Home Value in this Area
Purchase History
| Date | Buyer | Sale Price | Title Company |
|---|---|---|---|
| Sullivan Kevin C | $406,500 | -- | |
| Orbison Edith J | $215,000 | -- |
Source: Public Records
Mortgage History
| Date | Status | Borrower | Loan Amount |
|---|---|---|---|
| Open | Orbison Edith J | $260,000 | |
| Closed | Sullivan Kevin C | $260,000 | |
| Previous Owner | Orbison Edith J | $172,000 | |
| Previous Owner | Orbison Edith J | $95,000 | |
| Previous Owner | Orbison Edith J | $98,000 |
Source: Public Records
Tax History
| Year | Tax Paid | Tax Assessment Tax Assessment Total Assessment is a certain percentage of the fair market value that is determined by local assessors to be the total taxable value of land and additions on the property. | Land | Improvement |
|---|---|---|---|---|
| 2025 | $5,861 | $724,500 | $327,700 | $396,800 |
| 2024 | $5,496 | $703,700 | $327,700 | $376,000 |
| 2023 | $5,323 | $638,300 | $304,700 | $333,600 |
| 2022 | $4,719 | $489,500 | $210,700 | $278,800 |
| 2021 | $1,930 | $471,700 | $230,700 | $241,000 |
| 2020 | $4,985 | $454,800 | $230,700 | $224,100 |
| 2019 | $1,725 | $442,900 | $240,800 | $202,100 |
| 2018 | $1,641 | $413,800 | $242,900 | $170,900 |
| 2017 | $1,561 | $406,300 | $242,900 | $163,400 |
| 2016 | $4,445 | $407,800 | $244,400 | $163,400 |
| 2015 | $4,451 | $410,200 | $234,800 | $175,400 |
Source: Public Records
Map
Nearby Homes
- 60 Linden Ln
- 39 Tower Hill Rd Unit 1C
- 77 Robbins St
- 920 Main St Unit 1 Building 2
- 920 Main St Unit 2-1
- 33 Sunset Ln
- 48 Bayview Cir
- 177 Bayview Cir
- 414 Eel
- 53 Spice Ln
- 40 Waterfield Rd
- 117 Parsley Ln
- 16 2nd Ave Unit 4
- 146 Scudder Rd
- 199 E Bay Rd Unit 12
- 125 Wianno Cir
- 92 Wianno Cir
- 18 Winfield Way
- 82 Crystal Lake Rd
- 5 Briar Patch Rd
Your Personal Tour Guide
Ask me questions while you tour the home.