22 Morgan Dr Methuen, MA 01844
The North End NeighborhoodEstimated Value: $811,000 - $1,113,000
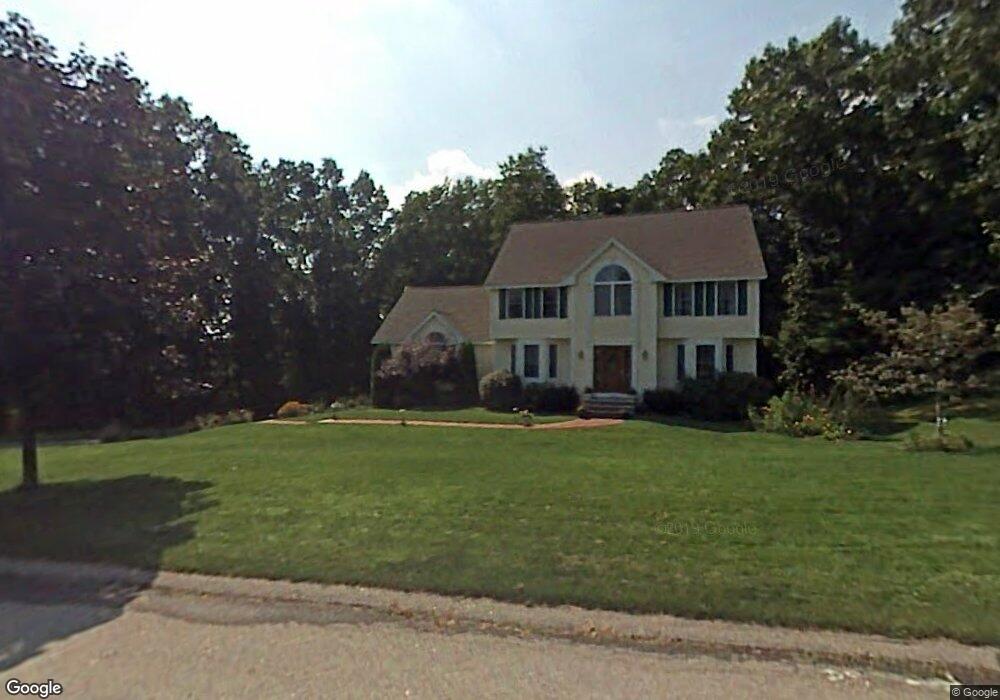
About This Home
This home is located at 22 Morgan Dr, Methuen, MA 01844 and is currently estimated at $937,656, approximately $323 per square foot. 22 Morgan Dr is a home located in Essex County with nearby schools including Methuen High School, St. Joseph Regional Catholic School, and Hilltop School.
Ownership History
We collect this data history from publicly available records. To have your information removed, we recommend requesting removal directly through your county’s website.
Purchase Details
Purchase Details
Home Financials for this Owner
Home Financials are based on the most recent Mortgage that was taken out on this home.Home Values in the Area
Average Home Value in this Area
Purchase History
We collect this data history from publicly available records. To have your information removed, we recommend requesting removal directly through your county’s website.
| Date | Buyer | Sale Price | Title Company |
|---|---|---|---|
| -- | None Available | ||
| -- | None Available | ||
| $289,900 | -- |
Mortgage History
We collect this data history from publicly available records. To have your information removed, we recommend requesting removal directly through your county’s website.
| Date | Status | Borrower | Loan Amount |
|---|---|---|---|
| Previous Owner | $273,000 | ||
| Previous Owner | $275,000 | ||
| Previous Owner | $246,400 |
Tax History
We collect this data history from publicly available records. To have your information removed, we recommend requesting removal directly through your county’s website.
| Year | Tax Paid | Tax Assessment Tax Assessment Total Assessment is a certain percentage of the fair market value that is determined by local assessors to be the total taxable value of land and additions on the property. | Land | Improvement |
|---|---|---|---|---|
| 2025 | $8,287 | $783,300 | $311,300 | $472,000 |
| 2024 | $8,161 | $751,500 | $274,100 | $477,400 |
| 2023 | $7,811 | $667,600 | $242,700 | $424,900 |
| 2022 | $7,898 | $605,200 | $222,000 | $383,200 |
| 2021 | $7,442 | $564,200 | $211,600 | $352,600 |
| 2020 | $7,376 | $548,800 | $211,600 | $337,200 |
| 2019 | $7,311 | $515,200 | $201,300 | $313,900 |
| 2018 | $7,126 | $499,400 | $201,300 | $298,100 |
| 2017 | $6,928 | $472,900 | $201,300 | $271,600 |
| 2016 | $6,925 | $467,600 | $201,300 | $266,300 |
| 2015 | $6,672 | $457,000 | $201,300 | $255,700 |
Map
- 10 Morgan Dr
- 5 Primrose Ln
- 92 Bridge St
- 240 Hampstead St
- 170 Hampstead St
- 40 Stanwood Rd Unit 9
- 43 Matthias St
- 3 Stanwood Rd
- 10 Dawn St
- 26 Flintlock Rd
- 74 Ayers Village Rd
- 1513 Broadway
- 384 Main St Unit 107
- 384 Main St Unit 101
- 0 Crystal St
- 40 Sherwood Cir
- 6 Remington
- 17 Hampstead Rd
- 1416 Broadway
- 11 Brookside Ct
Ask me questions while you tour the home.