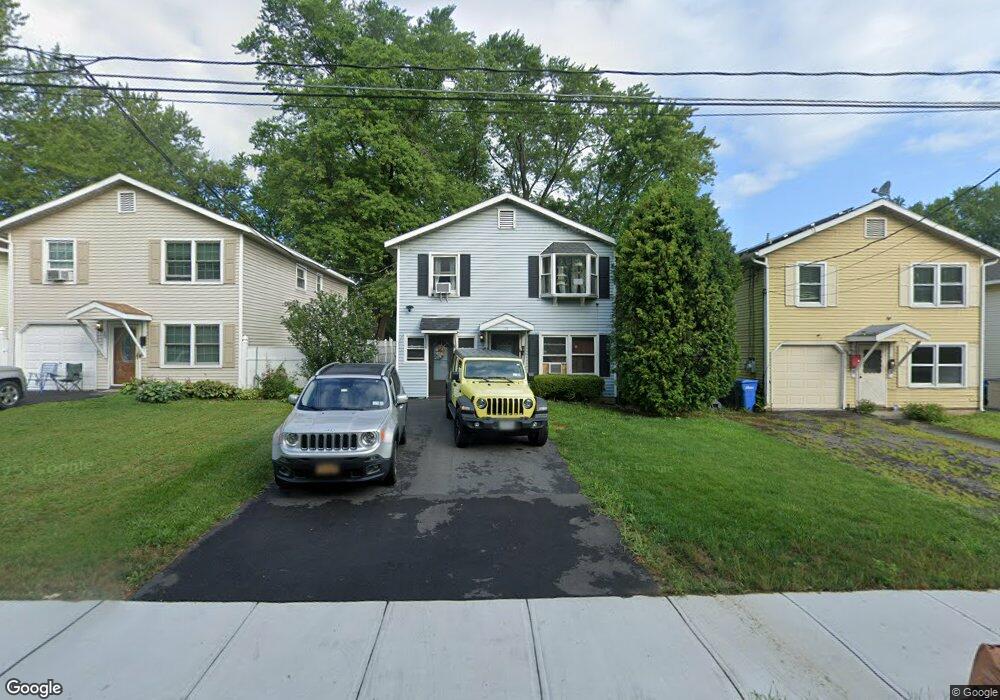
22 Rawson St Albany, NY 12206
West End NeighborhoodEstimated Value: $165,000 - $224,000
5
Beds
2
Baths
1,780
Sq Ft
$102/Sq Ft
Est. Value
About This Home
This home is located at 22 Rawson St, Albany, NY 12206 and is currently estimated at $182,347, approximately $102 per square foot. 22 Rawson St is a home located in Albany County with nearby schools including Pine Hills Elementary School, Stephen And Harriet Myers Middle School, and Albany High School.
Ownership History
Date
Name
Owned For
Owner Type
Purchase Details
Closed on
Sep 3, 2007
Current Estimated Value
Purchase Details
Closed on
Jul 6, 2007
Sold by
Wells Fargo Bank Wells Fargo Bank N and Wells Fargo Bank A
Bought by
Maccormick Neil
Home Financials for this Owner
Home Financials are based on the most recent Mortgage that was taken out on this home.
Original Mortgage
$86,100
Interest Rate
6.48%
Purchase Details
Closed on
Jun 26, 2007
Sold by
Wells Fargo Bank Na
Bought by
Maccormick Neil
Home Financials for this Owner
Home Financials are based on the most recent Mortgage that was taken out on this home.
Original Mortgage
$86,100
Interest Rate
6.48%
Purchase Details
Closed on
Nov 8, 2006
Purchase Details
Closed on
Jan 12, 2000
Sold by
Farrell Joseph V and Farrell Linda M
Bought by
Perkins Natasha S
Create a Home Valuation Report for This Property
The Home Valuation Report is an in-depth analysis detailing your home's value as well as a comparison with similar homes in the area
Home Values in the Area
Average Home Value in this Area
Purchase History
| Date | Buyer | Sale Price | Title Company |
|---|---|---|---|
| -- | -- | -- | |
| Maccormick Neil | -- | None Available | |
| Maccormick Neil | $86,500 | -- | |
| Maccormick Neil | $86,500 | None Available | |
| -- | $72,331 | -- | |
| Wells Fargo Bank Na | $72,331 | None Available | |
| Perkins Natasha S | $66,000 | Rosemary Mckenna |
Source: Public Records
Mortgage History
| Date | Status | Borrower | Loan Amount |
|---|---|---|---|
| Previous Owner | Maccormick Neil | $86,100 |
Source: Public Records
Tax History
| Year | Tax Paid | Tax Assessment Tax Assessment Total Assessment is a certain percentage of the fair market value that is determined by local assessors to be the total taxable value of land and additions on the property. | Land | Improvement |
|---|---|---|---|---|
| 2025 | $2,268 | $100,000 | $20,000 | $80,000 |
| 2024 | $2,268 | $100,000 | $20,000 | $80,000 |
| 2023 | $3,045 | $86,000 | $17,800 | $68,200 |
| 2022 | $2,904 | $86,000 | $17,800 | $68,200 |
| 2021 | $2,872 | $86,000 | $17,800 | $68,200 |
| 2020 | $2,825 | $86,000 | $17,800 | $68,200 |
| 2019 | $3,374 | $86,000 | $17,800 | $68,200 |
| 2018 | $3,258 | $86,000 | $17,800 | $68,200 |
| 2017 | $1,299 | $86,000 | $17,800 | $68,200 |
| 2016 | $2,568 | $86,000 | $17,800 | $68,200 |
| 2015 | $2,941 | $86,000 | $19,800 | $66,200 |
| 2014 | -- | $86,000 | $19,800 | $66,200 |
Source: Public Records
Map
Nearby Homes
Your Personal Tour Guide
Ask me questions while you tour the home.