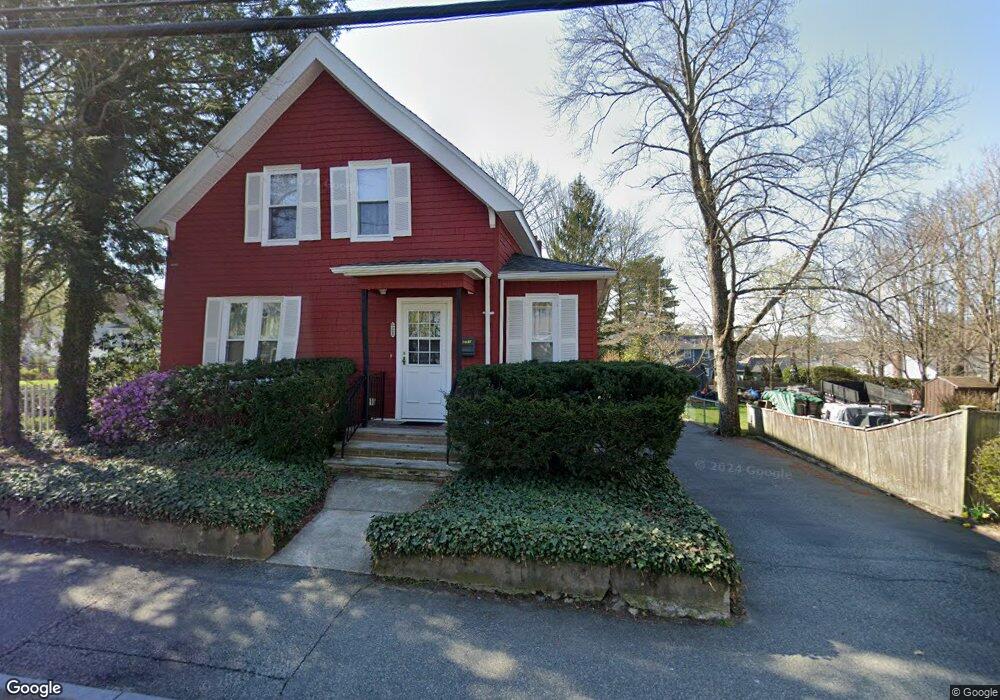
22 Sherman St Canton, MA 02021
Canton AreaEstimated Value: $660,000 - $900,000
About This Home
This home is located at 22 Sherman St, Canton, MA 02021 and is currently estimated at $739,869, approximately $412 per square foot. 22 Sherman St is a home located in Norfolk County with nearby schools including Canton High School and St. John the Evangelist School.
Ownership History
We collect this data history from publicly available records. To have your information removed, we recommend requesting removal directly through your county’s website.
Purchase Details
Purchase Details
Home Values in the Area
Average Home Value in this Area
Purchase History
We collect this data history from publicly available records. To have your information removed, we recommend requesting removal directly through your county’s website.
| Date | Buyer | Sale Price | Title Company |
|---|---|---|---|
| -- | -- | ||
| $54,900 | -- |
Mortgage History
We collect this data history from publicly available records. To have your information removed, we recommend requesting removal directly through your county’s website.
| Date | Status | Borrower | Loan Amount |
|---|---|---|---|
| Previous Owner | $155,000 |
Tax History
We collect this data history from publicly available records. To have your information removed, we recommend requesting removal directly through your county’s website.
| Year | Tax Paid | Tax Assessment Tax Assessment Total Assessment is a certain percentage of the fair market value that is determined by local assessors to be the total taxable value of land and additions on the property. | Land | Improvement |
|---|---|---|---|---|
| 2025 | $5,437 | $549,700 | $296,900 | $252,800 |
| 2024 | $5,270 | $528,600 | $285,500 | $243,100 |
| 2023 | $5,201 | $492,100 | $285,500 | $206,600 |
| 2022 | $5,098 | $449,200 | $271,900 | $177,300 |
| 2021 | $4,969 | $407,300 | $247,100 | $160,200 |
| 2020 | $4,746 | $388,100 | $235,400 | $152,700 |
| 2019 | $4,447 | $358,600 | $213,900 | $144,700 |
| 2018 | $4,284 | $344,900 | $205,700 | $139,200 |
| 2017 | $4,326 | $338,200 | $201,700 | $136,500 |
| 2016 | $4,223 | $330,200 | $196,800 | $133,400 |
| 2015 | $4,096 | $319,500 | $191,100 | $128,400 |
Map
- 79 Prospect St
- 8 Casey St
- 3 Fencourt Rd
- 862 Pleasant St
- 365 Bolivar St
- 20 Curtis Rd
- 20 Audubon Way Unit 102
- 20 Audubon Way Unit 306
- 20 Audubon Way Unit 305
- 6 Audubon Way Unit 6
- 62 Pleasant Cir
- 60 Coppersmith Way Unit 303
- 60 Coppersmith Way Unit 402
- 12 Danforth St
- 26 Pequit St
- 861 Washington St Unit 2
- 32 Centre St
- 1 Centre St Unit 9
- 149 Bolivar St Unit B2
- 4 Forge Pond Unit D
Ask me questions while you tour the home.