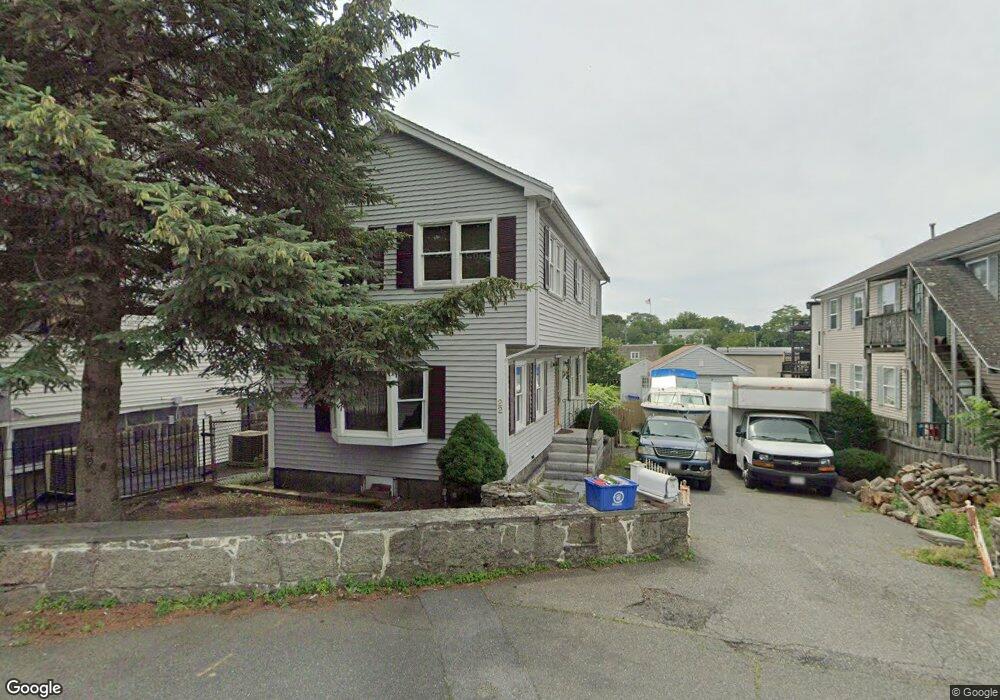
22 Spring St Peabody, MA 01960
Peabody Town Center NeighborhoodEstimated Value: $536,000 - $665,000
3
Beds
2
Baths
1,332
Sq Ft
$463/Sq Ft
Est. Value
About This Home
This home is located at 22 Spring St, Peabody, MA 01960 and is currently estimated at $616,899, approximately $463 per square foot. 22 Spring St is a home located in Essex County with nearby schools including Peabody Veterans Memorial High School, St John The Baptist School, and The Phoenix School.
Ownership History
Date
Name
Owned For
Owner Type
Purchase Details
Closed on
Jun 1, 1986
Bought by
Mendonca Diana M and Mendonca Jose B
Current Estimated Value
Create a Home Valuation Report for This Property
The Home Valuation Report is an in-depth analysis detailing your home's value as well as a comparison with similar homes in the area
Home Values in the Area
Average Home Value in this Area
Purchase History
We collect this data history from publicly available records. To have your information removed, we recommend requesting removal directly through your county’s website.
| Date | Buyer | Sale Price | Title Company |
|---|---|---|---|
| Mendonca Diana M | $114,000 | -- |
Source: Public Records
Mortgage History
We collect this data history from publicly available records. To have your information removed, we recommend requesting removal directly through your county’s website.
| Date | Status | Borrower | Loan Amount |
|---|---|---|---|
| Open | Mendonca Diana M | $290,200 | |
| Closed | Mendonca Diana M | $304,000 | |
| Closed | Mendonca Diana M | $15,000 |
Source: Public Records
Tax History
| Year | Tax Paid | Tax Assessment Tax Assessment Total Assessment is a certain percentage of the fair market value that is determined by local assessors to be the total taxable value of land and additions on the property. | Land | Improvement |
|---|---|---|---|---|
| 2025 | $4,989 | $538,800 | $227,600 | $311,200 |
| 2024 | $4,525 | $496,200 | $227,600 | $268,600 |
| 2023 | $4,423 | $464,600 | $197,900 | $266,700 |
| 2022 | $4,211 | $416,900 | $176,700 | $240,200 |
| 2021 | $4,110 | $391,800 | $160,700 | $231,100 |
| 2020 | $4,001 | $372,500 | $160,700 | $211,800 |
| 2019 | $3,994 | $362,800 | $160,700 | $202,100 |
| 2018 | $3,611 | $315,100 | $151,600 | $163,500 |
| 2017 | $3,674 | $312,400 | $151,600 | $160,800 |
| 2016 | $3,518 | $295,100 | $151,600 | $143,500 |
| 2015 | $3,502 | $284,700 | $152,600 | $132,100 |
Source: Public Records
Map
Nearby Homes
- 64 Foster St Unit 403
- 80 Foster St Unit 504
- 111 Foster St Unit 315
- 111 Foster St Unit 416
- 46 Walnut St
- 149 Washington St
- 6 Munroe St
- 24 Tracey St
- 16 Tremont St
- 112 Lowell St Unit 11
- 6 Glen Rd
- 41 Northend St
- 3 Southwick Rd
- 3 Witch Way
- 38-1/2 Ellsworth Rd
- 171 Lowell St
- 47 Emerson Street Extension
- 16 Thorndike St
- 23 Putnam St
- 13 Kirkland Rd
- 10 Winter St
- 10 Winter St Unit 1
- 12 Sanborn St
- 19 Spring St
- 10 Sanborn St
- 10 Sanborn St Unit 3
- 10 1/2 Winter St
- 10-1/2 Winter St Unit 1
- 8 Sanborn St
- 5 Elliott Place
- 24 Oak St
- 24 Oak St Unit 3
- 6 Sanborn St
- 11 Park St Unit 3
- 11 Park St Unit 1
- 11 Park St Unit 4
- 11 Park St
- 0 Elliott Place
- 7 Sanborn St
- 9 Sanborn St
Your Personal Tour Guide
Ask me questions while you tour the home.