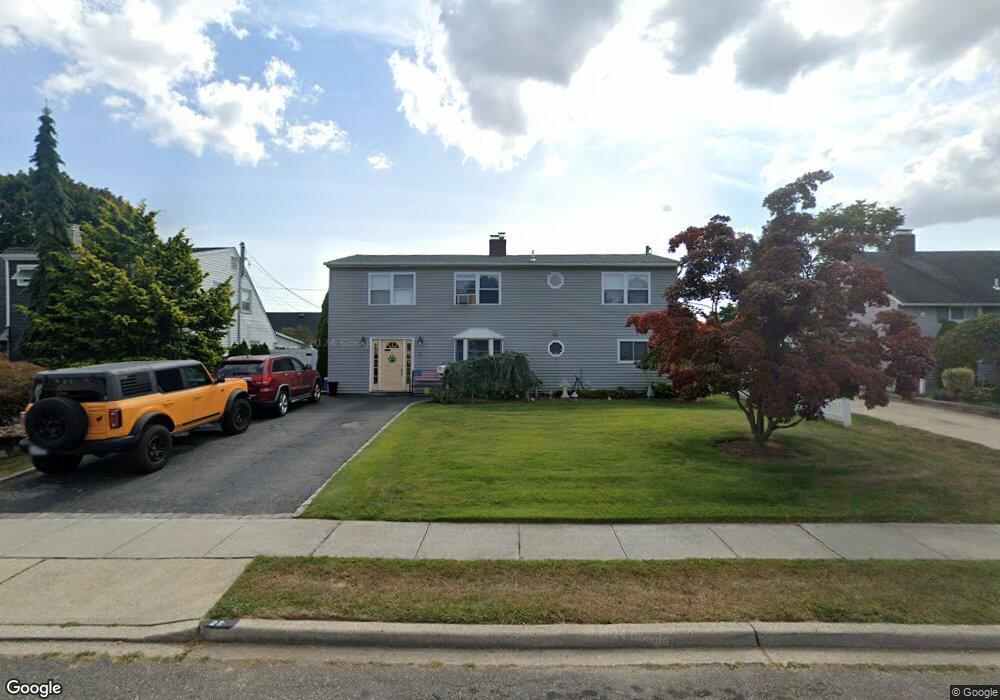
22 Thrush Ln Levittown, NY 11756
Estimated Value: $670,529 - $777,000
Studio
2
Baths
2,309
Sq Ft
$313/Sq Ft
Est. Value
About This Home
This home is located at 22 Thrush Ln, Levittown, NY 11756 and is currently estimated at $723,765, approximately $313 per square foot. 22 Thrush Ln is a home located in Nassau County with nearby schools including Northside School, Wisdom Lane Middle School, and Division Avenue Senior High School.
Ownership History
Date
Name
Owned For
Owner Type
Purchase Details
Closed on
Dec 11, 2012
Sold by
Mccarthy John J and Mccarthy Bridget
Bought by
Meyerowitz Jill and Meyerowitz Randy S
Current Estimated Value
Home Financials for this Owner
Home Financials are based on the most recent Mortgage that was taken out on this home.
Original Mortgage
$250,000
Outstanding Balance
$173,291
Interest Rate
3.38%
Mortgage Type
Purchase Money Mortgage
Estimated Equity
$550,474
Purchase Details
Closed on
Sep 25, 2002
Sold by
Mccarthy John
Purchase Details
Closed on
Feb 7, 1997
Sold by
Nelson Patricia
Bought by
Mccarthy John M and Mccarthy Bridget
Create a Home Valuation Report for This Property
The Home Valuation Report is an in-depth analysis detailing your home's value as well as a comparison with similar homes in the area
Home Values in the Area
Average Home Value in this Area
Purchase History
We collect this data history from publicly available records. To have your information removed, we recommend requesting removal directly through your county’s website.
| Date | Buyer | Sale Price | Title Company |
|---|---|---|---|
| Meyerowitz Jill | -- | -- | |
| -- | -- | -- | |
| Mccarthy John M | $115,000 | -- |
Source: Public Records
Mortgage History
We collect this data history from publicly available records. To have your information removed, we recommend requesting removal directly through your county’s website.
| Date | Status | Borrower | Loan Amount |
|---|---|---|---|
| Open | Meyerowitz Jill | $250,000 |
Source: Public Records
Tax History
| Year | Tax Paid | Tax Assessment Tax Assessment Total Assessment is a certain percentage of the fair market value that is determined by local assessors to be the total taxable value of land and additions on the property. | Land | Improvement |
|---|---|---|---|---|
| 2025 | $14,625 | $478 | $213 | $265 |
| 2024 | $3,974 | $488 | $218 | $270 |
| 2023 | $13,450 | $507 | $226 | $281 |
| 2022 | $13,450 | $488 | $226 | $262 |
| 2021 | $15,815 | $461 | $206 | $255 |
| 2020 | $10,479 | $537 | $474 | $63 |
| 2019 | $10,020 | $575 | $476 | $99 |
| 2018 | $10,006 | $614 | $0 | $0 |
| 2017 | $6,963 | $652 | $480 | $172 |
| 2016 | $10,274 | $690 | $410 | $280 |
| 2015 | $3,414 | $729 | $433 | $296 |
| 2014 | $3,414 | $729 | $433 | $296 |
| 2013 | $3,683 | $855 | $508 | $347 |
Source: Public Records
Map
Nearby Homes
- 7 Woodpecker Ln
- 1 Woodpecker Ln
- 6 Snowbird Ln
- 40 Tanager Ln
- 61 Kingfisher Rd
- 319 Blacksmith Rd W
- 307 Blacksmith Rd
- 26 Family Ln
- 60 Flamingo Rd
- 45 Horn Ln
- 72 Horn Ln
- 471 Division Ave
- 95 Lantern Rd
- 253 Blacksmith Rd S
- 43 Barter Ln
- 15 Falcon Ln
- 57 Meeting Ln
- 63 Morning Glory Rd
- 45 Meeting Ln
- 35 Meeting Ln
Your Personal Tour Guide
Ask me questions while you tour the home.