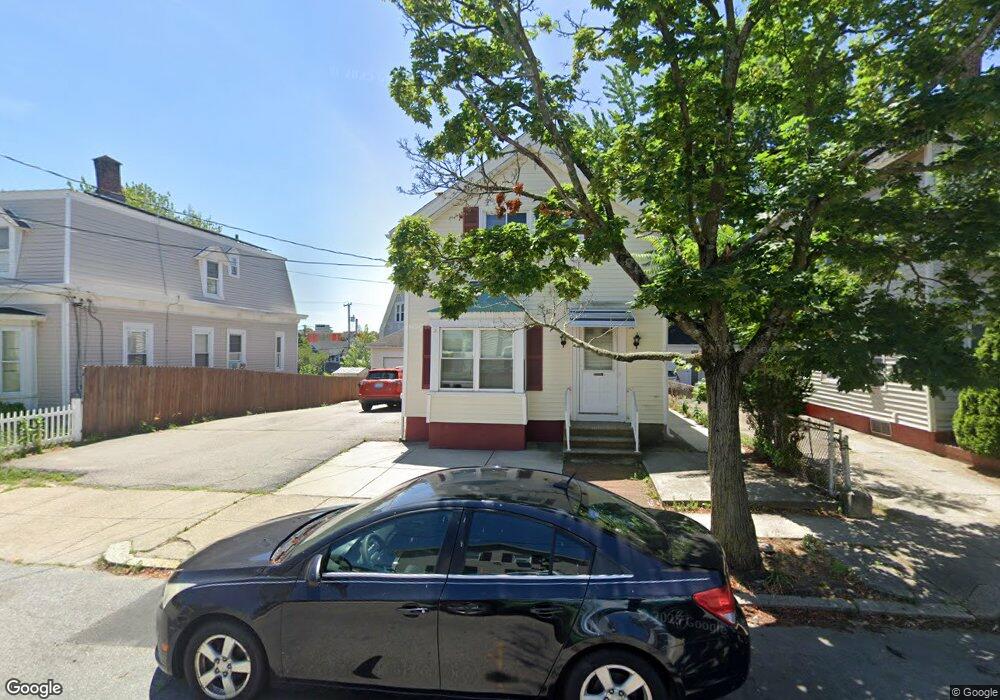
22 Webb St Pawtucket, RI 02860
Woodlawn NeighborhoodEstimated Value: $404,000 - $515,000
3
Beds
2
Baths
1,700
Sq Ft
$260/Sq Ft
Est. Value
About This Home
This home is located at 22 Webb St, Pawtucket, RI 02860 and is currently estimated at $442,552, approximately $260 per square foot. 22 Webb St is a home located in Providence County with nearby schools including International Charter School, Blackstone Valley Prep Junior High School, and Blackstone Academy Charter School.
Ownership History
Date
Name
Owned For
Owner Type
Purchase Details
Closed on
Sep 27, 2002
Sold by
Percy Manuel and Percy Roase Florine
Bought by
Dasilva Jeanne
Current Estimated Value
Home Financials for this Owner
Home Financials are based on the most recent Mortgage that was taken out on this home.
Original Mortgage
$134,950
Outstanding Balance
$55,877
Interest Rate
6.25%
Estimated Equity
$386,675
Create a Home Valuation Report for This Property
The Home Valuation Report is an in-depth analysis detailing your home's value as well as a comparison with similar homes in the area
Home Values in the Area
Average Home Value in this Area
Purchase History
We collect this data history from publicly available records. To have your information removed, we recommend requesting removal directly through your county’s website.
| Date | Buyer | Sale Price | Title Company |
|---|---|---|---|
| Dasilva Jeanne | $140,000 | -- |
Source: Public Records
Mortgage History
We collect this data history from publicly available records. To have your information removed, we recommend requesting removal directly through your county’s website.
| Date | Status | Borrower | Loan Amount |
|---|---|---|---|
| Open | Dasilva Jeanne | $134,950 | |
| Previous Owner | Dasilva Jeanne | $35,000 | |
| Previous Owner | Dasilva Jeanne | $77,750 |
Source: Public Records
Tax History
| Year | Tax Paid | Tax Assessment Tax Assessment Total Assessment is a certain percentage of the fair market value that is determined by local assessors to be the total taxable value of land and additions on the property. | Land | Improvement |
|---|---|---|---|---|
| 2025 | $4,300 | $327,000 | $114,800 | $212,200 |
| 2024 | $4,035 | $327,000 | $114,800 | $212,200 |
| 2023 | $3,842 | $226,800 | $51,700 | $175,100 |
| 2022 | $3,760 | $226,800 | $51,700 | $175,100 |
| 2021 | $3,760 | $226,800 | $51,700 | $175,100 |
| 2020 | $3,672 | $175,800 | $52,300 | $123,500 |
| 2019 | $3,672 | $175,800 | $52,300 | $123,500 |
| 2018 | $3,539 | $175,800 | $52,300 | $123,500 |
| 2017 | $3,222 | $141,800 | $38,800 | $103,000 |
| 2016 | $3,104 | $141,800 | $38,800 | $103,000 |
| 2015 | $3,104 | $141,800 | $38,800 | $103,000 |
| 2014 | $3,185 | $138,100 | $49,900 | $88,200 |
Source: Public Records
Map
Nearby Homes
Your Personal Tour Guide
Ask me questions while you tour the home.