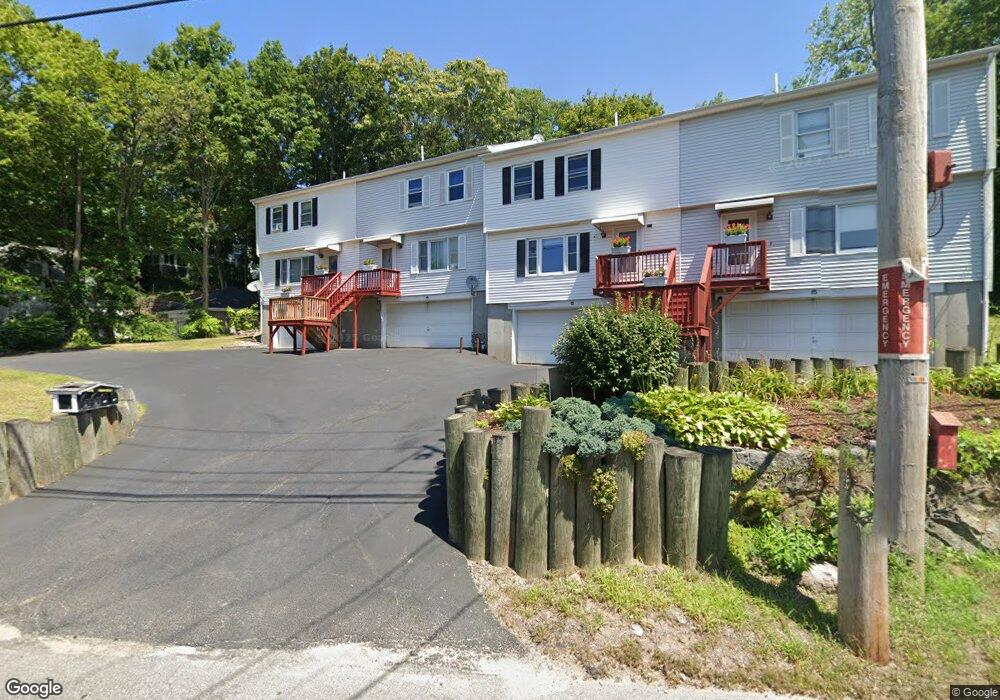
220 Common St Quincy, MA 02169
South Quincy NeighborhoodEstimated Value: $423,000 - $562,000
2
Beds
3
Baths
1,187
Sq Ft
$405/Sq Ft
Est. Value
About This Home
This home is located at 220 Common St, Quincy, MA 02169 and is currently estimated at $480,780, approximately $405 per square foot. 220 Common St is a home located in Norfolk County with nearby schools including South West Middle School, Lincoln-Hancock Community School, and Quincy High School.
Ownership History
Date
Name
Owned For
Owner Type
Purchase Details
Closed on
Sep 8, 2014
Sold by
Sze Ho Y and Sze Ho W
Bought by
Sze Steve
Current Estimated Value
Home Financials for this Owner
Home Financials are based on the most recent Mortgage that was taken out on this home.
Original Mortgage
$190,000
Outstanding Balance
$62,602
Interest Rate
4.12%
Mortgage Type
New Conventional
Estimated Equity
$418,178
Purchase Details
Closed on
Oct 13, 1998
Sold by
Scotti Tr Michael R
Bought by
Fallon Margie M and Fallon John F
Home Financials for this Owner
Home Financials are based on the most recent Mortgage that was taken out on this home.
Original Mortgage
$119,900
Interest Rate
6.92%
Purchase Details
Closed on
Feb 18, 1987
Sold by
Cantelli Doris
Bought by
220 Common St Rt
Create a Home Valuation Report for This Property
The Home Valuation Report is an in-depth analysis detailing your home's value as well as a comparison with similar homes in the area
Home Values in the Area
Average Home Value in this Area
Purchase History
| Date | Buyer | Sale Price | Title Company |
|---|---|---|---|
| Sze Steve | -- | -- | |
| Fallon Margie M | $126,255 | -- | |
| 220 Common St Rt | $144,000 | -- |
Source: Public Records
Mortgage History
| Date | Status | Borrower | Loan Amount |
|---|---|---|---|
| Open | Sze Steve | $190,000 | |
| Previous Owner | 220 Common St Rt | $71,051 | |
| Previous Owner | 220 Common St Rt | $37,028 | |
| Previous Owner | 220 Common St Rt | $119,900 |
Source: Public Records
Tax History
| Year | Tax Paid | Tax Assessment Tax Assessment Total Assessment is a certain percentage of the fair market value that is determined by local assessors to be the total taxable value of land and additions on the property. | Land | Improvement |
|---|---|---|---|---|
| 2025 | $4,847 | $420,400 | $0 | $420,400 |
| 2024 | $4,525 | $401,500 | $0 | $401,500 |
| 2023 | $4,399 | $395,200 | $0 | $395,200 |
| 2022 | $3,983 | $332,500 | $0 | $332,500 |
| 2021 | $3,841 | $316,400 | $0 | $316,400 |
| 2020 | $3,809 | $306,400 | $0 | $306,400 |
| 2019 | $3,693 | $294,300 | $0 | $294,300 |
| 2018 | $3,643 | $273,100 | $0 | $273,100 |
| 2017 | $3,642 | $257,000 | $0 | $257,000 |
| 2016 | $3,502 | $243,900 | $0 | $243,900 |
| 2015 | $3,416 | $234,000 | $0 | $234,000 |
| 2014 | $3,242 | $218,200 | $0 | $218,200 |
Source: Public Records
Map
Nearby Homes
- 211 Copeland St
- 283 Copeland St
- 452 Quarry St
- 14 Hall Place Unit 2
- 156 West St
- 211 West St Unit 11B
- 211 West St Unit 4B
- 211 West St Unit 12B
- 312 Adams St
- 165 Whitwell St
- 115 Bunker Hill Ln
- 51 Branch St Unit 3
- 22 Ames St
- 43 Dixwell Ave
- 475 Beale St
- 33 Bishop Rd Unit 33
- 21 Totman St Unit 205
- 21 Totman St Unit 403
- 21 Totman St Unit 301
- 21 Totman St Unit 204
- 220 Common St Unit 218
- 218 Common St
- 216 Common St
- 214 Common St
- 218 Common St Unit 218
- 212 Common St
- 215 Common St Unit 5
- 215 Common St Unit 4
- 215 Common St Unit 3
- 215 Common St Unit 2
- 215 Common St Unit 1
- 231 Common St
- 206 Common St
- 202 Common St
- 72 Filbert St
- 209 Common St
- 237 Common St
- 201 Common St
- 245 Common St
- 196 Common St
Your Personal Tour Guide
Ask me questions while you tour the home.