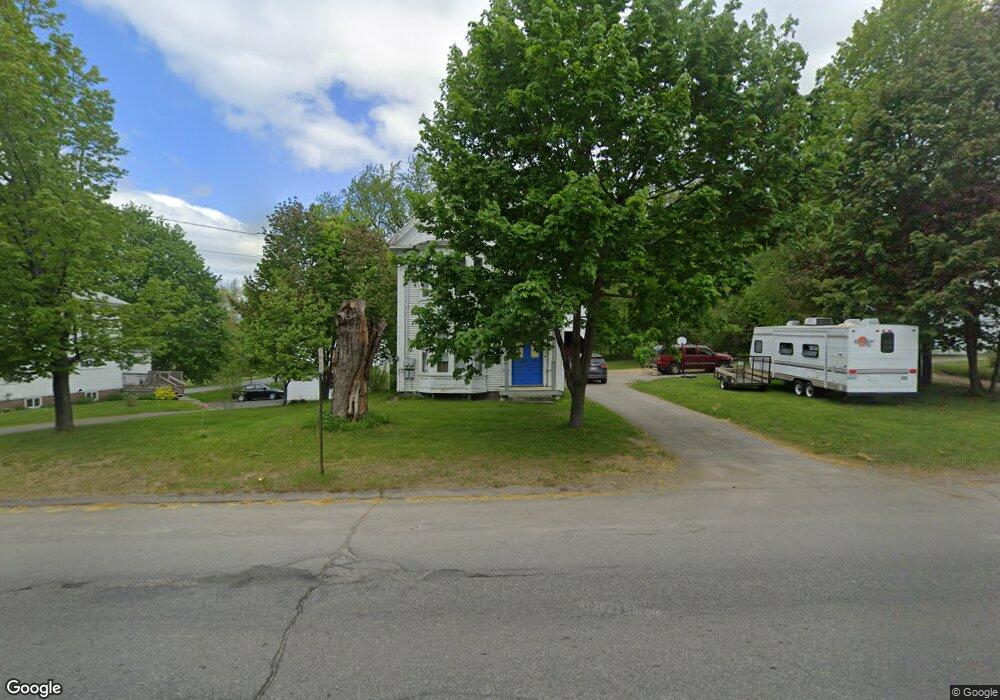
220 Main St Unit 2 Madison, ME 04950
Estimated Value: $167,000 - $243,000
2
Beds
2
Baths
1,792
Sq Ft
$109/Sq Ft
Est. Value
About This Home
This home is located at 220 Main St Unit 2, Madison, ME 04950 and is currently estimated at $194,587, approximately $108 per square foot. 220 Main St Unit 2 is a home located in Somerset County with nearby schools including Madison Area Memorial High School.
Ownership History
Date
Name
Owned For
Owner Type
Purchase Details
Closed on
Oct 4, 2024
Sold by
Chick Freeman T
Bought by
Burn Kyle and Burn Kimberly
Current Estimated Value
Home Financials for this Owner
Home Financials are based on the most recent Mortgage that was taken out on this home.
Original Mortgage
$15,000
Outstanding Balance
$14,757
Interest Rate
6.46%
Mortgage Type
Purchase Money Mortgage
Estimated Equity
$179,830
Purchase Details
Closed on
Nov 25, 2008
Sold by
Stpeter Clifford E and Stpeter Tammy L
Bought by
Meader Theodore
Create a Home Valuation Report for This Property
The Home Valuation Report is an in-depth analysis detailing your home's value as well as a comparison with similar homes in the area
Home Values in the Area
Average Home Value in this Area
Purchase History
| Date | Buyer | Sale Price | Title Company |
|---|---|---|---|
| Burn Kyle | -- | None Available | |
| Burn Kyle | -- | None Available | |
| Meader Theodore | -- | -- | |
| Meader Theodore | -- | -- |
Source: Public Records
Mortgage History
| Date | Status | Borrower | Loan Amount |
|---|---|---|---|
| Open | Burn Kyle | $15,000 | |
| Closed | Burn Kyle | $15,000 |
Source: Public Records
Tax History
| Year | Tax Paid | Tax Assessment Tax Assessment Total Assessment is a certain percentage of the fair market value that is determined by local assessors to be the total taxable value of land and additions on the property. | Land | Improvement |
|---|---|---|---|---|
| 2025 | $1,696 | $118,600 | $39,800 | $78,800 |
| 2024 | $1,426 | $88,600 | $35,300 | $53,300 |
| 2023 | $1,274 | $76,300 | $29,900 | $46,400 |
| 2022 | $1,140 | $61,300 | $24,000 | $37,300 |
| 2021 | $1,152 | $59,300 | $22,900 | $36,400 |
| 2020 | $1,224 | $57,600 | $22,900 | $34,700 |
| 2019 | $1,211 | $57,000 | $22,700 | $34,300 |
| 2018 | $1,226 | $57,000 | $22,700 | $34,300 |
| 2017 | $1,226 | $57,000 | $22,700 | $34,300 |
| 2016 | $922 | $57,000 | $22,700 | $34,300 |
| 2015 | $1,112 | $57,000 | $22,700 | $34,300 |
| 2014 | $1,112 | $57,000 | $22,700 | $34,300 |
| 2013 | $999 | $57,000 | $22,700 | $34,300 |
Source: Public Records
Map
Nearby Homes
Your Personal Tour Guide
Ask me questions while you tour the home.