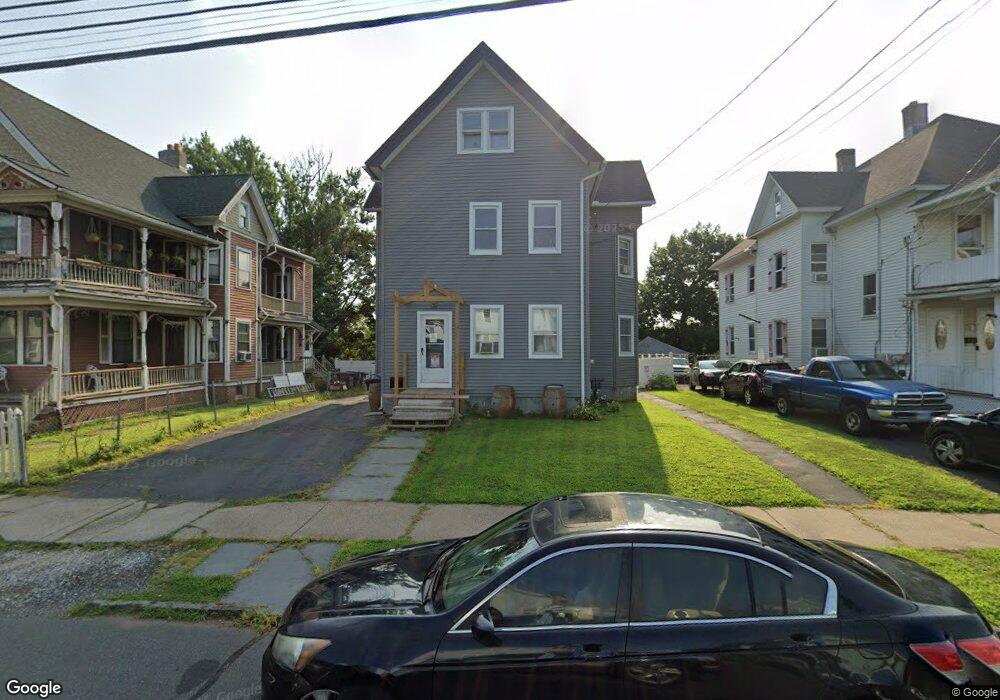
220 Maple St New Britain, CT 06051
Estimated Value: $343,615 - $499,000
8
Beds
3
Baths
3,038
Sq Ft
$146/Sq Ft
Est. Value
About This Home
This home is located at 220 Maple St, New Britain, CT 06051 and is currently estimated at $442,904, approximately $145 per square foot. 220 Maple St is a home located in Hartford County with nearby schools including Northend School, Slade Middle School, and Raymond Hill School.
Ownership History
Date
Name
Owned For
Owner Type
Purchase Details
Closed on
Jun 2, 2008
Sold by
Kotek Richard J and Kotek Linda A
Bought by
Garcia Julien and Diaz Marie Z
Current Estimated Value
Home Financials for this Owner
Home Financials are based on the most recent Mortgage that was taken out on this home.
Original Mortgage
$202,750
Interest Rate
5.91%
Create a Home Valuation Report for This Property
The Home Valuation Report is an in-depth analysis detailing your home's value as well as a comparison with similar homes in the area
Home Values in the Area
Average Home Value in this Area
Purchase History
| Date | Buyer | Sale Price | Title Company |
|---|---|---|---|
| Garcia Julien | $206,000 | -- |
Source: Public Records
Mortgage History
| Date | Status | Borrower | Loan Amount |
|---|---|---|---|
| Open | Garcia Julien | $185,522 | |
| Closed | Garcia Julien | $9,017 | |
| Closed | Garcia Julien | $198,563 | |
| Closed | Garcia Julien | $202,750 |
Source: Public Records
Tax History
| Year | Tax Paid | Tax Assessment Tax Assessment Total Assessment is a certain percentage of the fair market value that is determined by local assessors to be the total taxable value of land and additions on the property. | Land | Improvement |
|---|---|---|---|---|
| 2025 | $7,633 | $194,810 | $37,310 | $157,500 |
| 2024 | $7,438 | $187,880 | $37,310 | $150,570 |
| 2023 | $7,192 | $187,880 | $37,310 | $150,570 |
| 2022 | $4,993 | $100,870 | $10,640 | $90,230 |
| 2021 | $4,993 | $100,870 | $10,640 | $90,230 |
| 2020 | $5,094 | $100,870 | $10,640 | $90,230 |
| 2019 | $5,094 | $100,870 | $10,640 | $90,230 |
| 2018 | $5,094 | $100,870 | $10,640 | $90,230 |
| 2017 | $5,221 | $103,390 | $12,040 | $91,350 |
| 2016 | $5,221 | $103,390 | $12,040 | $91,350 |
| 2015 | $5,066 | $103,390 | $12,040 | $91,350 |
| 2014 | $5,066 | $103,390 | $12,040 | $91,350 |
Source: Public Records
Map
Nearby Homes
Your Personal Tour Guide
Ask me questions while you tour the home.