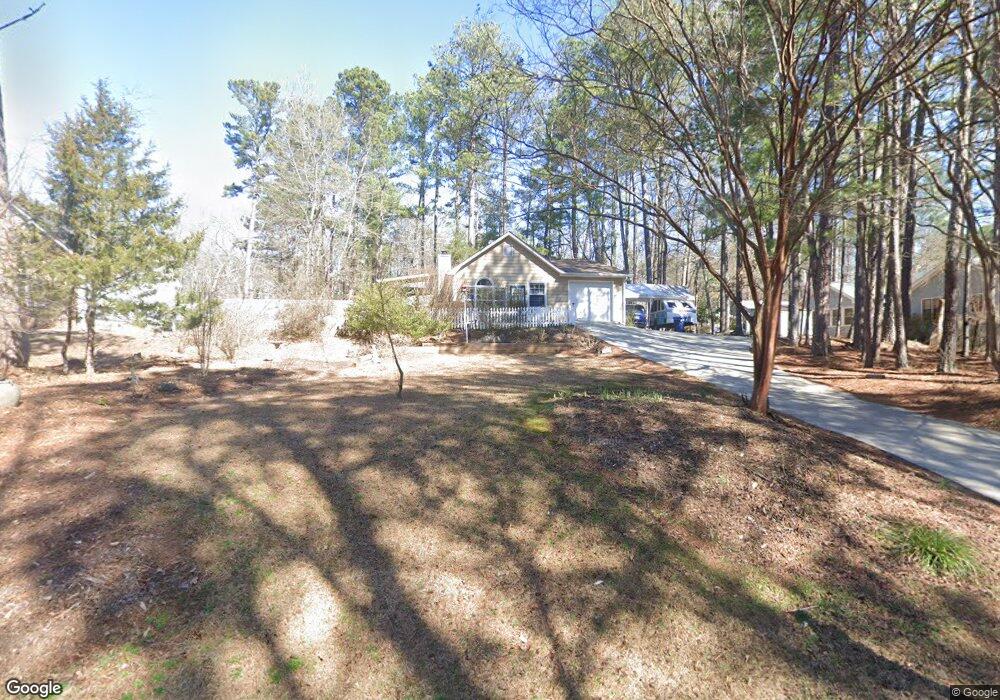
220 Pointers Ridge Dr Athens, GA 30606
Estimated Value: $249,555 - $272,000
3
Beds
2
Baths
1,140
Sq Ft
$229/Sq Ft
Est. Value
About This Home
This home is located at 220 Pointers Ridge Dr, Athens, GA 30606 and is currently estimated at $260,889, approximately $228 per square foot. 220 Pointers Ridge Dr is a home located in Clarke County with nearby schools including Whitehead Road Elementary School, Burney-Harris-Lyons Middle School, and Clarke Central High School.
Ownership History
Date
Name
Owned For
Owner Type
Purchase Details
Closed on
Mar 23, 2022
Sold by
Moon Julie Ann
Bought by
Jsquared Partners Llc
Current Estimated Value
Purchase Details
Closed on
Dec 17, 2021
Sold by
Howard Teresa W
Bought by
Moon Julie Ann and Moon Joe
Purchase Details
Closed on
Dec 19, 2016
Sold by
Galen B
Bought by
Howard Teresa W and Howard Dallas A
Purchase Details
Closed on
Jun 26, 2007
Sold by
Not Provided
Bought by
Kaufman Galen B
Purchase Details
Closed on
May 4, 2007
Sold by
Not Provided
Bought by
Kaufman Galen B
Purchase Details
Closed on
Feb 27, 1998
Sold by
Holland Melanie M
Bought by
Deangelis Gina M
Purchase Details
Closed on
Apr 26, 1991
Sold by
Armour Homes Inc
Bought by
Holland Melanie M
Purchase Details
Closed on
Jun 12, 1990
Sold by
J Ronnie Huff Inc
Bought by
Armour Homes Inc
Purchase Details
Closed on
Dec 5, 1989
Sold by
Padgett John L
Bought by
J Ronnie Huff Inc
Create a Home Valuation Report for This Property
The Home Valuation Report is an in-depth analysis detailing your home's value as well as a comparison with similar homes in the area
Purchase History
| Date | Buyer | Sale Price | Title Company |
|---|---|---|---|
| Jsquared Partners Llc | -- | -- | |
| Moon Julie Ann | $171,000 | -- | |
| Howard Teresa W | $120,000 | -- | |
| Kaufman Galen B | $120,000 | -- | |
| Kaufman Galen B | $113,000 | -- | |
| Deangelis Gina M | $84,500 | -- | |
| Holland Melanie M | $62,900 | -- | |
| Armour Homes Inc | $12,500 | -- | |
| J Ronnie Huff Inc | -- | -- |
Source: Public Records
Tax History
| Year | Tax Paid | Tax Assessment Tax Assessment Total Assessment is a certain percentage of the fair market value that is determined by local assessors to be the total taxable value of land and additions on the property. | Land | Improvement |
|---|---|---|---|---|
| 2025 | $3,121 | $100,528 | $14,000 | $86,528 |
| 2024 | $3,121 | $93,733 | $12,000 | $81,733 |
| 2023 | $2,929 | $87,714 | $12,000 | $75,714 |
| 2022 | $2,182 | $72,155 | $10,400 | $61,755 |
| 2021 | $1,499 | $59,579 | $10,400 | $49,179 |
| 2020 | $1,380 | $53,290 | $10,400 | $42,890 |
| 2019 | $1,341 | $49,694 | $9,600 | $40,094 |
| 2018 | $1,337 | $49,369 | $9,600 | $39,769 |
| 2017 | $0 | $47,942 | $9,600 | $38,342 |
| 2016 | $1,338 | $39,416 | $9,600 | $29,816 |
| 2015 | $1,229 | $36,138 | $9,600 | $26,538 |
| 2014 | $1,149 | $33,757 | $9,600 | $24,157 |
Source: Public Records
Map
Nearby Homes
- 110 Covey Ln
- 149 Hunters Crossing Rd
- 370 Camelot Dr
- 355 Camelot Dr
- 395 Roberts Rd
- 395 Round Table Rd
- 533 Edgewood Dr
- 584 Edgewood Dr
- 413 Jasmine Trail
- 574 Whitehead Rd
- 309 Jasmine Trail
- 300 Lavender Rd
- 240 Clifton Dr
- 201 Wisteria Way
- 447 Whitehead Rd
- 149 Caroline Ave
- 285 Kings Cir
- 389 Ashton Dr
- 207 Wisteria Way
- 380 Ashton Dr
- 230 Pointers Ridge Dr
- 150 Covey Ln
- 130 Covey Ln
- 380 Quailwood Dr
- 215 Pointers Ridge Dr
- 370 Quailwood Dr
- 240 Pointers Ridge Dr
- 170 Covey Ln
- 155 Covey Ln
- 145 Covey Ln
- 180 Pointers Ridge Dr
- 175 Covey Ln
- 375 Quailwood Dr
- 125 Covey Ln
- 115 Dove Valley Dr
- 190 Covey Ln
- 105 Covey Ln
- 170 Pointers Ridge Dr
- 385 Quailwood Dr
- 100 Dove Valley Dr
Your Personal Tour Guide
Ask me questions while you tour the home.