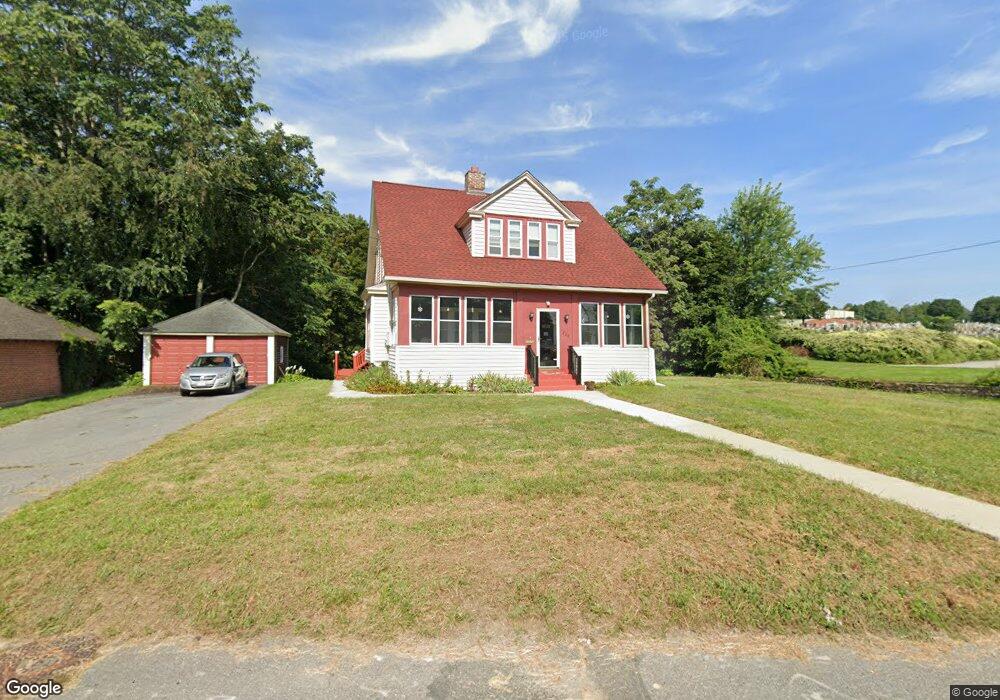
220 Webster St Worcester, MA 01603
Hadwen Park NeighborhoodEstimated Value: $396,983 - $477,000
About This Home
This home is located at 220 Webster St, Worcester, MA 01603 and is currently estimated at $450,246, approximately $274 per square foot. 220 Webster St is a home located in Worcester County with nearby schools including Jacob Hiatt Magnet School, Chandler Magnet, and Heard Street Discovery Academy.
Ownership History
We collect this data history from publicly available records. To have your information removed, we recommend requesting removal directly through your county’s website.
Purchase Details
Home Values in the Area
Average Home Value in this Area
Purchase History
We collect this data history from publicly available records. To have your information removed, we recommend requesting removal directly through your county’s website.
| Date | Buyer | Sale Price | Title Company |
|---|---|---|---|
| $93,900 | -- |
Mortgage History
We collect this data history from publicly available records. To have your information removed, we recommend requesting removal directly through your county’s website.
| Date | Status | Borrower | Loan Amount |
|---|---|---|---|
| Open | $55,023 | ||
| Closed | $10,000 | ||
| Closed | $41,136 |
Tax History
We collect this data history from publicly available records. To have your information removed, we recommend requesting removal directly through your county’s website.
| Year | Tax Paid | Tax Assessment Tax Assessment Total Assessment is a certain percentage of the fair market value that is determined by local assessors to be the total taxable value of land and additions on the property. | Land | Improvement |
|---|---|---|---|---|
| 2025 | $4,044 | $306,600 | $99,800 | $206,800 |
| 2024 | $3,964 | $288,300 | $99,800 | $188,500 |
| 2023 | $3,810 | $265,700 | $86,900 | $178,800 |
| 2022 | $3,483 | $229,000 | $69,600 | $159,400 |
| 2021 | $3,419 | $210,000 | $55,800 | $154,200 |
| 2020 | $3,310 | $194,700 | $55,300 | $139,400 |
| 2019 | $3,109 | $172,700 | $48,700 | $124,000 |
| 2018 | $3,097 | $163,800 | $48,700 | $115,100 |
| 2017 | $2,996 | $155,900 | $48,700 | $107,200 |
| 2016 | $2,982 | $144,700 | $36,100 | $108,600 |
| 2015 | $2,904 | $144,700 | $36,100 | $108,600 |
| 2014 | $2,827 | $144,700 | $36,100 | $108,600 |
Map
- 12 Shore Dr
- 23 Cowden St
- 121 Hope Ave
- 99 Clover St
- 5 Lyman St
- 83 Shore Dr
- 20 Rockaway Rd
- 1 New York St
- 11 Hulbert Rd Unit 15
- 13 Marilyn Dr
- 20 Pinehurst Ave
- 39 Pinehurst Ave
- 1 Eames Ave
- 9 Nixon Ave
- 177 Boyce St
- 27 Malvern Rd
- 29 Cambridge St
- 160 Fremont St Unit 105
- 160 Fremont St Unit 317
- 160 Fremont St Unit 213
Ask me questions while you tour the home.