Estimated Value: $72,000 - $129,000
About This Home
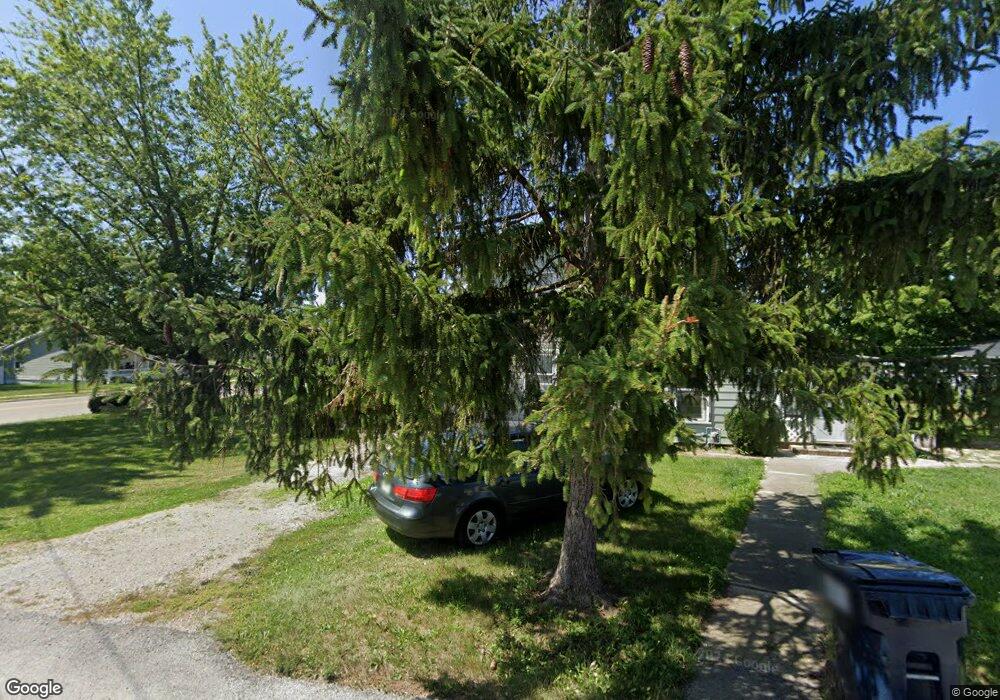
This home is located at 221 E Main St, Cairo, OH 45820 and is currently estimated at $107,646, approximately $93 per square foot. 221 E Main St is a home with nearby schools including Bath Elementary School, Bath Middle School, and Bath High School.
Ownership History
We collect this data history from publicly available records. To have your information removed, we recommend requesting removal directly through your county’s website.
Purchase Details
Home Financials for this Owner
Home Financials are based on the most recent Mortgage that was taken out on this home.Purchase Details
Purchase Details
Purchase Details
Purchase Details
Purchase Details
Purchase Details
Purchase History
We collect this data history from publicly available records. To have your information removed, we recommend requesting removal directly through your county’s website.
| Date | Buyer | Sale Price | Title Company |
|---|---|---|---|
| $101,000 | None Listed On Document | ||
| $30,000 | -- | ||
| $7,000 | None Available | ||
| -- | None Available | ||
| -- | None Available | ||
| -- | None Available | ||
| -- | -- | ||
| -- | -- |
Mortgage History
We collect this data history from publicly available records. To have your information removed, we recommend requesting removal directly through your county’s website.
| Date | Status | Borrower | Loan Amount |
|---|---|---|---|
| Open | $97,950 |
Tax History
We collect this data history from publicly available records. To have your information removed, we recommend requesting removal directly through your county’s website.
| Year | Tax Paid | Tax Assessment Tax Assessment Total Assessment is a certain percentage of the fair market value that is determined by local assessors to be the total taxable value of land and additions on the property. | Land | Improvement |
|---|---|---|---|---|
| 2025 | $751 | $17,930 | $7,250 | $10,680 |
| 2024 | $776 | $17,930 | $7,250 | $10,680 |
| 2023 | $1,281 | $12,710 | $5,150 | $7,560 |
| 2022 | $635 | $12,710 | $5,150 | $7,560 |
| 2021 | $628 | $12,710 | $5,150 | $7,560 |
| 2020 | $625 | $11,660 | $4,940 | $6,720 |
| 2019 | $625 | $11,660 | $4,940 | $6,720 |
| 2018 | $612 | $11,660 | $4,940 | $6,720 |
| 2017 | $565 | $10,650 | $4,940 | $5,710 |
| 2016 | $953 | $18,490 | $4,940 | $13,550 |
| 2015 | $957 | $18,490 | $4,940 | $13,550 |
| 2014 | $957 | $18,030 | $4,660 | $13,370 |
| 2013 | $958 | $18,030 | $4,660 | $13,370 |
Map
- 414 Wall St
- 7626-7650 Ramsey Rd
- 0000 State Rd W
- 4387 N West St
- 3951 Sugar Creek Rd
- 3263 Shiloh Dr
- 3775 Wolfe Rd
- 0 Fraunfelter Unit 307817
- 0 N Eastown Rd Unit 1034495
- 0 Thorndyke Dr
- 3137 Thorndyke Dr
- 2525 W Lincoln Hwy
- 520 Kenmore St
- 0 Stewart Rd Unit 1044859
- 0 Stewart Rd Unit 309909
- 5025 N Cool Rd
- 611 Saint Clair Ave
- 524 Sandpiper St
- 1907 N Elizabeth St
- 2721 Carolyn Dr
Ask me questions while you tour the home.