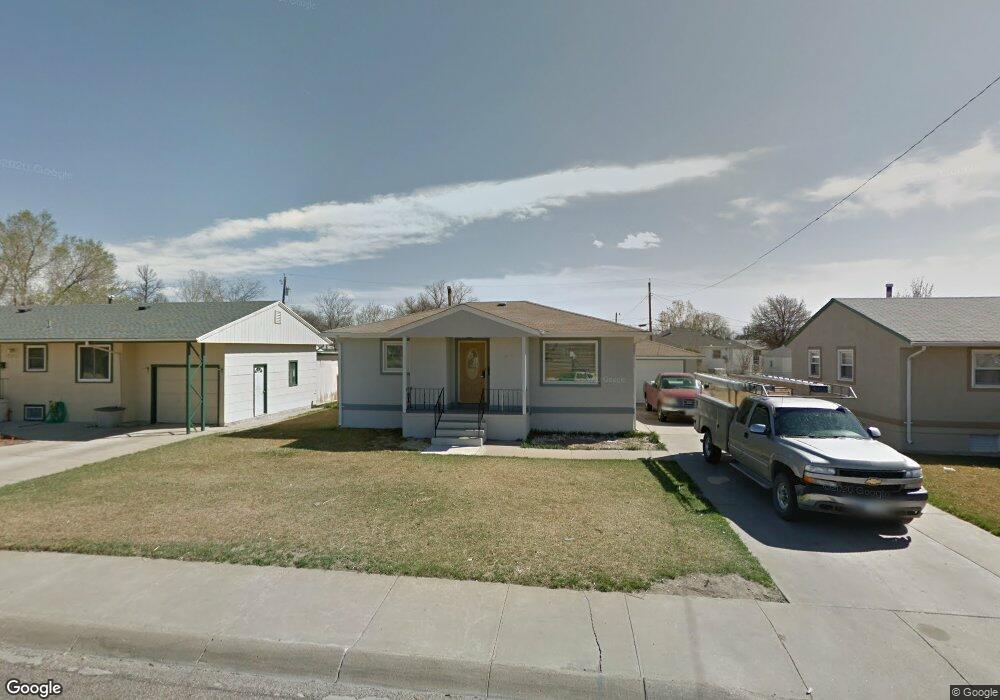
2213 Don Dr Scottsbluff, NE 69361
Estimated Value: $124,000 - $173,000
3
Beds
1
Bath
900
Sq Ft
$165/Sq Ft
Est. Value
About This Home
This home is located at 2213 Don Dr, Scottsbluff, NE 69361 and is currently estimated at $148,643, approximately $165 per square foot. 2213 Don Dr is a home located in Scotts Bluff County with nearby schools including Lincoln Heights Elementary School, Bluffs Middle School, and Scottsbluff Senior High School.
Ownership History
Date
Name
Owned For
Owner Type
Purchase Details
Closed on
Jan 6, 2022
Sold by
Munoz Llc
Bought by
Zavala Marco and Zavala Kathryn
Current Estimated Value
Purchase Details
Closed on
Jun 18, 2007
Sold by
Schmidt Steve and Schmidt Nancy
Bought by
Knaub Dwight L and Knaub Mitzi D
Home Financials for this Owner
Home Financials are based on the most recent Mortgage that was taken out on this home.
Original Mortgage
$70,000
Interest Rate
6.37%
Mortgage Type
New Conventional
Create a Home Valuation Report for This Property
The Home Valuation Report is an in-depth analysis detailing your home's value as well as a comparison with similar homes in the area
Home Values in the Area
Average Home Value in this Area
Purchase History
| Date | Buyer | Sale Price | Title Company |
|---|---|---|---|
| Zavala Marco | $5,000 | None Listed On Document | |
| Knaub Dwight L | $1,777 | -- |
Source: Public Records
Mortgage History
| Date | Status | Borrower | Loan Amount |
|---|---|---|---|
| Previous Owner | Knaub Dwight L | $70,000 |
Source: Public Records
Tax History
| Year | Tax Paid | Tax Assessment Tax Assessment Total Assessment is a certain percentage of the fair market value that is determined by local assessors to be the total taxable value of land and additions on the property. | Land | Improvement |
|---|---|---|---|---|
| 2025 | $1,656 | $137,385 | $14,850 | $122,535 |
| 2024 | $1,498 | $119,580 | $14,850 | $104,730 |
| 2023 | $1,974 | $97,466 | $9,900 | $87,566 |
| 2022 | $1,974 | $97,466 | $9,900 | $87,566 |
| 2021 | $1,840 | $89,505 | $9,900 | $79,605 |
| 2020 | $1,788 | $86,443 | $9,900 | $76,543 |
| 2019 | $1,739 | $84,214 | $9,900 | $74,314 |
| 2018 | $1,649 | $79,352 | $9,900 | $69,452 |
| 2017 | $1,612 | $77,329 | $9,900 | $67,429 |
| 2016 | $1,614 | $77,329 | $9,900 | $67,429 |
| 2015 | $1,602 | $77,329 | $9,900 | $67,429 |
| 2014 | $1,380 | $71,199 | $9,900 | $61,299 |
| 2012 | -- | $71,199 | $9,900 | $61,299 |
Source: Public Records
Map
Nearby Homes
Your Personal Tour Guide
Ask me questions while you tour the home.