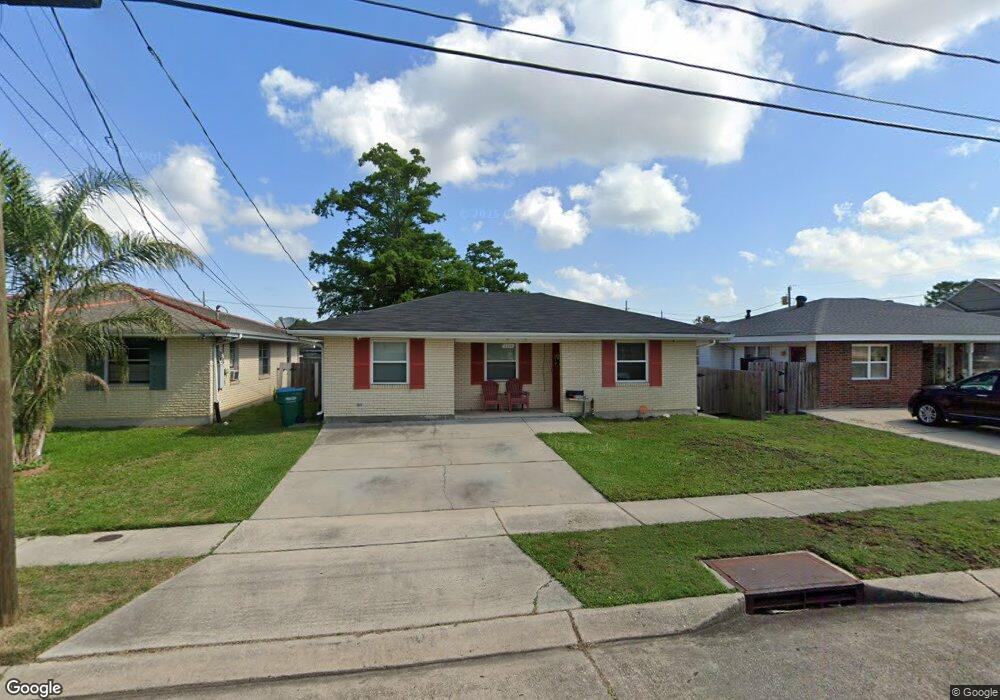
2214 31st Ct Kenner, LA 70065
3
Beds
2
Baths
1,441
Sq Ft
--
Built
About This Home
This home is located at 2214 31st Ct, Kenner, LA 70065. 2214 31st Ct is a home located in Jefferson Parish with nearby schools including Airline Park Academy For Advanced Studies, Bonnabel Magnet Academy High School, and Atonement Lutheran School.
Create a Home Valuation Report for This Property
The Home Valuation Report is an in-depth analysis detailing your home's value as well as a comparison with similar homes in the area
Home Values in the Area
Average Home Value in this Area
Tax History
| Year | Tax Paid | Tax Assessment Tax Assessment Total Assessment is a certain percentage of the fair market value that is determined by local assessors to be the total taxable value of land and additions on the property. | Land | Improvement |
|---|---|---|---|---|
| 2025 | $370 | $12,240 | $3,230 | $9,010 |
| 2024 | $1,352 | $12,240 | $3,230 | $9,010 |
| 2023 | $408 | $11,610 | $3,230 | $8,380 |
| 2022 | $1,131 | $11,610 | $3,230 | $8,380 |
| 2021 | $1,043 | $11,610 | $3,230 | $8,380 |
| 2020 | $1,033 | $11,610 | $3,230 | $8,380 |
| 2019 | $1,055 | $11,610 | $3,230 | $8,380 |
| 2018 | $270 | $11,610 | $3,230 | $8,380 |
| 2017 | $961 | $11,610 | $3,230 | $8,380 |
| 2016 | $961 | $11,610 | $3,230 | $8,380 |
| 2015 | $265 | $11,500 | $3,230 | $8,270 |
| 2014 | $265 | $11,500 | $3,230 | $8,270 |
Source: Public Records
Map
Nearby Homes
- 3120 Indiana Ave
- 3116 Indiana Ave
- 3124 Indiana Ave
- 3128 Indiana Ave
- 3132 Indiana Ave
- 3112 Indiana Ave
- 2218 31st Ct
- 2119 31st Ct
- 3108 Indiana Ave
- 3104 Indiana Ave
- 3121 Iowa Ave
- 3117 Iowa Ave
- 2216 31st Ct
- 3129 Iowa Ave
- 2217 31st Ct
- 3136 Indiana Ave
- 3113 Iowa Ave
- 3107 Indiana Ave
- 3109 Indiana Ave
- 3133 Iowa Ave
Your Personal Tour Guide
Ask me questions while you tour the home.