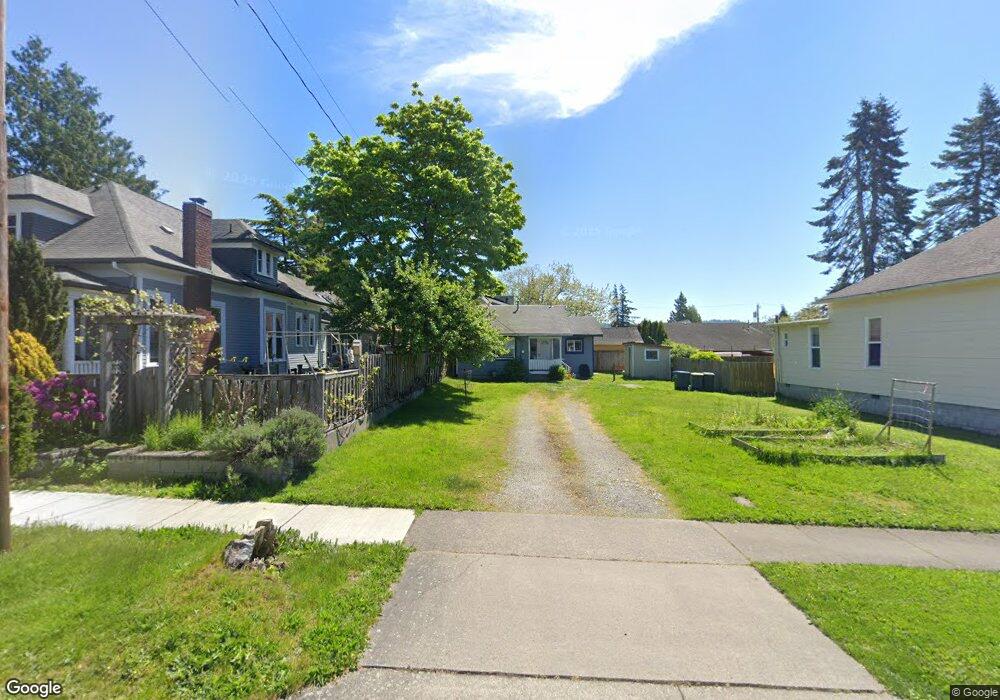
2216 E St Bellingham, WA 98225
Lettered Streets NeighborhoodEstimated Value: $446,941 - $548,000
2
Beds
1
Bath
700
Sq Ft
$716/Sq Ft
Est. Value
About This Home
This home is located at 2216 E St, Bellingham, WA 98225 and is currently estimated at $501,485, approximately $716 per square foot. 2216 E St is a home located in Whatcom County with nearby schools including Parkview Elementary School, Whatcom Middle School, and Bellingham High School.
Ownership History
Date
Name
Owned For
Owner Type
Purchase Details
Closed on
Aug 21, 2012
Sold by
Halvorson Roderick Blair
Bought by
Koch Christopher John and Koch Krista Anne
Current Estimated Value
Home Financials for this Owner
Home Financials are based on the most recent Mortgage that was taken out on this home.
Original Mortgage
$92,500
Outstanding Balance
$62,965
Interest Rate
3.53%
Mortgage Type
New Conventional
Estimated Equity
$438,520
Create a Home Valuation Report for This Property
The Home Valuation Report is an in-depth analysis detailing your home's value as well as a comparison with similar homes in the area
Home Values in the Area
Average Home Value in this Area
Purchase History
| Date | Buyer | Sale Price | Title Company |
|---|---|---|---|
| Koch Christopher John | $130,280 | Whatcom Land Title |
Source: Public Records
Mortgage History
| Date | Status | Borrower | Loan Amount |
|---|---|---|---|
| Open | Koch Christopher John | $92,500 |
Source: Public Records
Tax History
| Year | Tax Paid | Tax Assessment Tax Assessment Total Assessment is a certain percentage of the fair market value that is determined by local assessors to be the total taxable value of land and additions on the property. | Land | Improvement |
|---|---|---|---|---|
| 2025 | $3,403 | $427,996 | $253,696 | $174,300 |
| 2024 | $3,318 | $415,526 | $246,304 | $169,222 |
| 2023 | $3,318 | $426,080 | $252,560 | $173,520 |
| 2022 | $2,708 | $367,317 | $217,728 | $149,589 |
| 2021 | $2,657 | $291,521 | $172,800 | $118,721 |
| 2020 | $2,521 | $269,927 | $160,000 | $109,927 |
| 2019 | $2,257 | $247,574 | $141,415 | $106,159 |
| 2018 | $2,273 | $222,246 | $126,965 | $95,281 |
| 2017 | $1,958 | $191,345 | $109,310 | $82,035 |
| 2016 | $1,714 | $172,254 | $98,090 | $74,164 |
| 2015 | $1,681 | $157,035 | $89,590 | $67,445 |
| 2014 | -- | $148,990 | $85,000 | $63,990 |
| 2013 | -- | $133,120 | $73,500 | $59,620 |
Source: Public Records
Map
Nearby Homes
- 10 E St
- 9 E St
- 0 D St
- 2101 Young St
- 2500 Cornwall Ave
- 1310 Ellsworth St
- 1112 Cornwall Ave
- 2517 Peabody St
- 1011 Bancroft St Unit 204
- 409 Kentucky St
- 809 W Connecticut St
- 1310 G St
- 403 Alabama St
- 1200 W Holly St
- 1315 Astor St
- 2119 Humboldt St
- 2600 Elm St
- 503 W Illinois St
- 605 Alabama St
- 1025 Granary Ave Unit 306
Your Personal Tour Guide
Ask me questions while you tour the home.