2217 Bell St Columbus, GA 31906
East Wynnton-Wynnton Hill NeighborhoodEstimated Value: $58,000 - $98,000
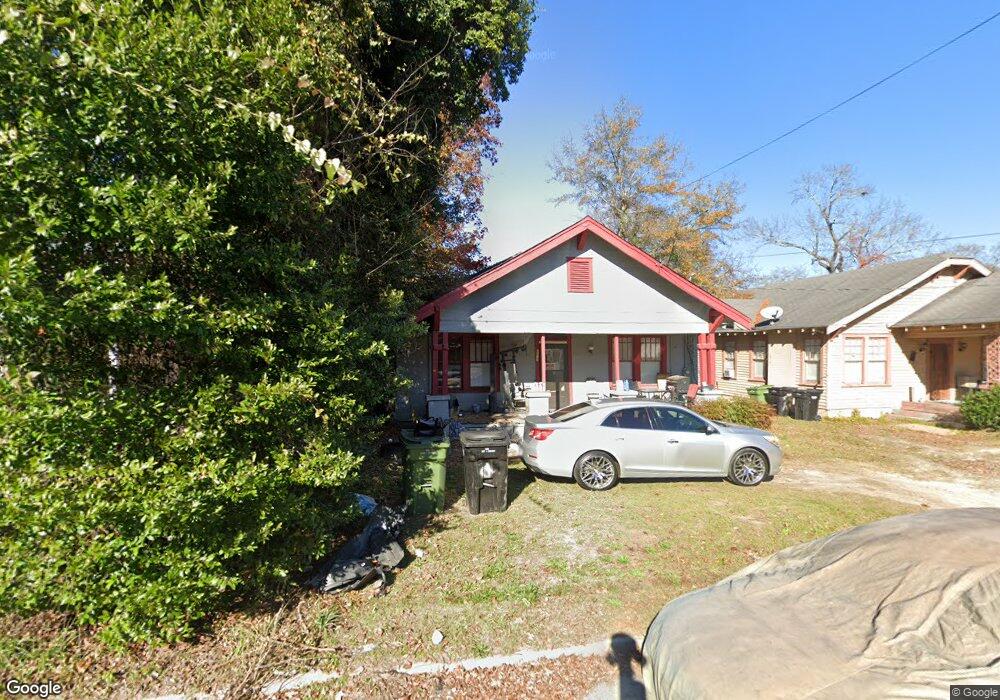
About This Home
This home is located at 2217 Bell St, Columbus, GA 31906 and is currently estimated at $72,758, approximately $61 per square foot. 2217 Bell St is a home located in Muscogee County with nearby schools including Rigdon Road Elementary School, Baker Middle School, and Carver High School.
Ownership History
We collect this data history from publicly available records. To have your information removed, we recommend requesting removal directly through your county’s website.
Purchase Details
Purchase Details
Purchase Details
Home Values in the Area
Average Home Value in this Area
Purchase History
We collect this data history from publicly available records. To have your information removed, we recommend requesting removal directly through your county’s website.
| Date | Buyer | Sale Price | Title Company |
|---|---|---|---|
| $30,000 | -- | ||
| $40,000 | None Available | ||
| -- | None Available |
Tax History
We collect this data history from publicly available records. To have your information removed, we recommend requesting removal directly through your county’s website.
| Year | Tax Paid | Tax Assessment Tax Assessment Total Assessment is a certain percentage of the fair market value that is determined by local assessors to be the total taxable value of land and additions on the property. | Land | Improvement |
|---|---|---|---|---|
| 2025 | $691 | $17,664 | $3,812 | $13,852 |
| 2024 | $691 | $17,664 | $3,812 | $13,852 |
| 2023 | $696 | $17,664 | $3,812 | $13,852 |
| 2022 | $451 | $11,052 | $3,812 | $7,240 |
| 2021 | $206 | $5,024 | $3,812 | $1,212 |
| 2020 | $205 | $5,024 | $3,812 | $1,212 |
| 2019 | $206 | $5,024 | $3,812 | $1,212 |
| 2018 | $492 | $12,000 | $2,760 | $9,240 |
| 2017 | $677 | $16,472 | $3,812 | $12,660 |
| 2016 | $629 | $15,260 | $2,005 | $13,255 |
| 2015 | $252 | $15,260 | $2,005 | $13,255 |
| 2014 | $252 | $15,260 | $2,005 | $13,255 |
| 2013 | -- | $15,260 | $2,005 | $13,255 |
Map
- 2207 Bell St
- 1103 Bryan Ave
- 1033 Britt Ave
- 2400 Schaul St
- 1031 Lawyers Ln
- 1228 Cedar Ave
- 1002 Lawyers Ln
- 2621 Lewis St
- 1255 Cedar Ave Unit 5
- 957 Overlook Dr
- 822 Coolidge Ave
- 1205 Munro Ave
- 2134 13th St
- 745 Brown Ave
- 1164 Tate Dr
- 2221 13th St
- 2217 13th St
- 752 Portland Ave
- 1016 Samson Ave
- 2726 Marion St
Ask me questions while you tour the home.