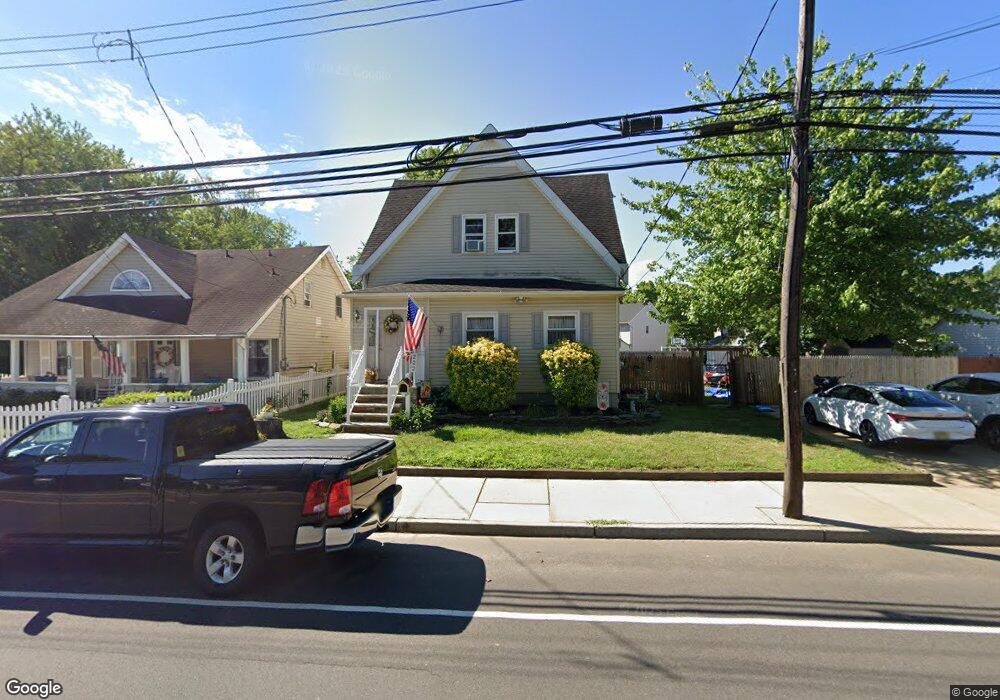
222 Broadway Union Beach, NJ 07735
Estimated Value: $408,000 - $613,253
5
Beds
2
Baths
1,957
Sq Ft
$237/Sq Ft
Est. Value
About This Home
This home is located at 222 Broadway, Union Beach, NJ 07735 and is currently estimated at $463,563, approximately $236 per square foot. 222 Broadway is a home located in Monmouth County with nearby schools including Keyport Central School, Keyport High School, and Icob Academy.
Ownership History
Date
Name
Owned For
Owner Type
Purchase Details
Closed on
Jun 15, 2023
Sold by
Velos Inc
Bought by
Omer Investment Llc
Current Estimated Value
Home Financials for this Owner
Home Financials are based on the most recent Mortgage that was taken out on this home.
Original Mortgage
$438,750
Interest Rate
5.75%
Mortgage Type
Construction
Purchase Details
Closed on
Feb 12, 1986
Bought by
Velos, Inc % Town & County Inn
Create a Home Valuation Report for This Property
The Home Valuation Report is an in-depth analysis detailing your home's value as well as a comparison with similar homes in the area
Home Values in the Area
Average Home Value in this Area
Purchase History
| Date | Buyer | Sale Price | Title Company |
|---|---|---|---|
| Omer Investment Llc | $300,000 | Old Republic Title | |
| Velos, Inc % Town & County Inn | $53,000 | -- |
Source: Public Records
Mortgage History
| Date | Status | Borrower | Loan Amount |
|---|---|---|---|
| Closed | Omer Investment Llc | $438,750 |
Source: Public Records
Tax History
| Year | Tax Paid | Tax Assessment Tax Assessment Total Assessment is a certain percentage of the fair market value that is determined by local assessors to be the total taxable value of land and additions on the property. | Land | Improvement |
|---|---|---|---|---|
| 2025 | $6,620 | $356,000 | $230,600 | $125,400 |
| 2024 | $9,188 | $319,800 | $200,600 | $119,200 |
| 2023 | $9,188 | $418,000 | $182,400 | $235,600 |
| 2022 | $7,688 | $335,300 | $158,600 | $176,700 |
| 2021 | $7,688 | $304,600 | $146,800 | $157,800 |
| 2020 | $7,321 | $287,900 | $137,800 | $150,100 |
| 2019 | $6,995 | $275,500 | $128,800 | $146,700 |
| 2018 | $6,916 | $266,000 | $128,800 | $137,200 |
| 2017 | $6,890 | $264,300 | $128,800 | $135,500 |
| 2016 | $6,641 | $256,900 | $128,800 | $128,100 |
| 2015 | $7,095 | $273,200 | $146,800 | $126,400 |
| 2014 | $6,893 | $268,000 | $139,300 | $128,700 |
Source: Public Records
Map
Nearby Homes
- 106 Chingarora Ave
- 253 Broadway
- 52 Highway 35
- 155 Luppatatong Ave
- 284 Washington St
- 95 Broadway
- 2 Chingarora Ave
- 44 Beers St Unit A
- 55 Lower Main St
- 9 Kearney St
- 308 Main St
- 248 Division St
- 226 Osborn St
- 174 Church St
- 9 Hurley St
- 14 1st St
- 81 Village Green Way
- 154 Lower Main St
- 55 E Front St
- 5 Barrier Dr
Your Personal Tour Guide
Ask me questions while you tour the home.