
Seller's Agent in 2013
Deborah Rieders
Corcoran Group
(718) 923-8001
14 in this area
426 Total Sales
Estimated Value: $4,285,000 - $5,827,244
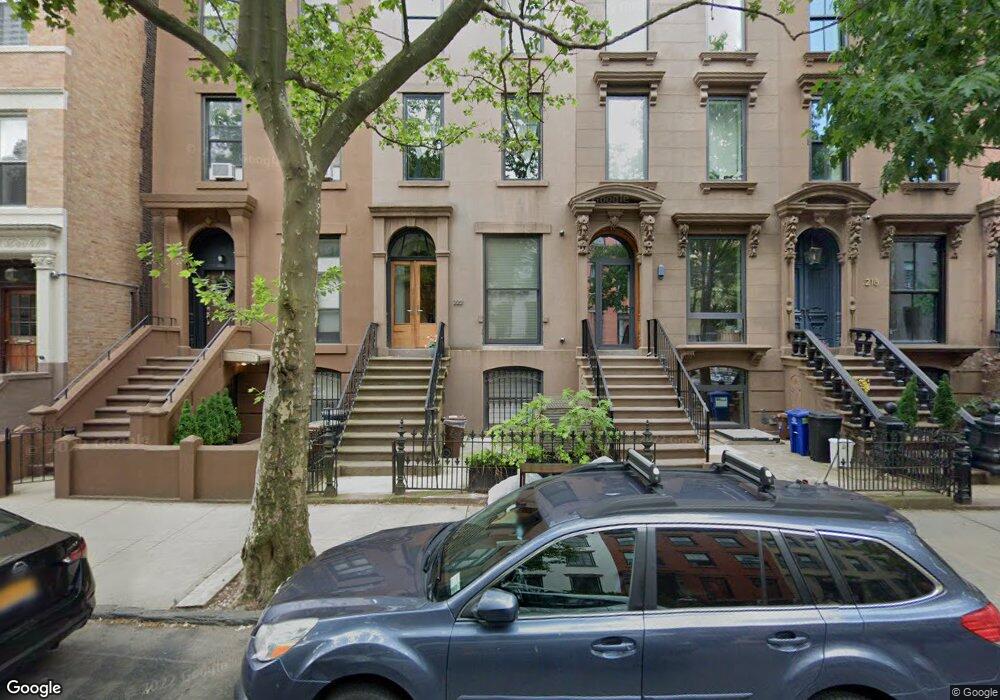
This home is located at 222 Carroll St, Brooklyn, NY 11231 since 18 March 2013 and is currently estimated at $4,758,561, approximately $2,070 per square foot. 222 Carroll St is a home located in Kings County with nearby schools including P.S. 58 - The Carroll, A. Fantis School of Saints Constantine and Helen Cathedral, and St Ann's School.
Last Agent to Sell the Property
Corcoran Group License #30RI0955004 Listed on: 03/18/2013
| Date | Buyer | Sale Price | Title Company |
|---|---|---|---|
| Dubeck Leslie | $2,500,000 | -- | |
| 222 Carroll Llc | $1,900,000 | -- | |
| Samalin Andrew E | -- | -- | |
| Lamonica Vincent | -- | -- |
| Date | Status | Borrower | Loan Amount |
|---|---|---|---|
| Open | Dubeck Leslie | $1,750,000 | |
| Previous Owner | 222 Carroll Llc | $1,425,000 |
| Date | Event | Price | List to Sale | Price per Sq Ft |
|---|---|---|---|---|
| 10/03/2013 10/03/13 | Sold | -- | -- | -- |
| 09/03/2013 09/03/13 | Pending | -- | -- | -- |
| 03/18/2013 03/18/13 | For Sale | $2,650,000 | -- | $1,153 / Sq Ft |
| Year | Tax Paid | Tax Assessment Tax Assessment Total Assessment is a certain percentage of the fair market value that is determined by local assessors to be the total taxable value of land and additions on the property. | Land | Improvement |
|---|---|---|---|---|
| 2025 | $12,051 | $284,940 | $32,940 | $252,000 |
| 2024 | $12,051 | $225,060 | $32,940 | $192,120 |
| 2023 | $12,051 | $198,900 | $32,940 | $165,960 |
| 2022 | $11,804 | $162,780 | $32,940 | $129,840 |
| 2021 | $11,540 | $125,700 | $32,940 | $92,760 |
| 2020 | $3,860 | $36,900 | $15,540 | $21,360 |
| 2019 | $6,531 | $260,280 | $116,550 | $143,730 |
| 2018 | $0 | $47,975 | $25,779 | $22,196 |
| 2016 | $5,308 | $41,176 | $27,772 | $13,404 |
| 2015 | $3,446 | $41,174 | $22,217 | $18,957 |
| 2014 | $3,446 | $39,835 | $17,195 | $22,640 |
Seller's Agent in 2013
Deborah Rieders
Corcoran Group
(718) 923-8001
14 in this area
426 Total Sales
Source: Real Estate Board of New York (REBNY)
MLS Number: RLS10468695
APN: 00356-0022
Disclaimer: Certain information contained herein is derived from information provided by parties other than Homes.com. All information provided is deemed reliable, but is not guaranteed to be accurate and should be independently verified.
![]() This information is not verified for authenticity or accuracy and is not guaranteed and may not reflect all real estate activity in the market. ©2026 The Real Estate Board of New York, Inc., All rights reserved.
This information is not verified for authenticity or accuracy and is not guaranteed and may not reflect all real estate activity in the market. ©2026 The Real Estate Board of New York, Inc., All rights reserved.
RLS Data display by Homes.com LLC
Ask me questions while you tour the home.