222 Podunk Rd Sturbridge, MA 01566
Sturbridge AreaEstimated Value: $498,000 - $537,000
About This Home
This home is located at 222 Podunk Rd, Sturbridge, MA 01566 and is currently estimated at $519,846, approximately $322 per square foot. 222 Podunk Rd is a home located in Worcester County with nearby schools including Burgess Elementary School, Tantasqua Regional Junior High School, and Tantasqua Regional High School.
Ownership History
We collect this data history from publicly available records. To have your information removed, we recommend requesting removal directly through your county’s website.
Purchase Details
Home Values in the Area
Average Home Value in this Area
Purchase History
We collect this data history from publicly available records. To have your information removed, we recommend requesting removal directly through your county’s website.
| Date | Buyer | Sale Price | Title Company |
|---|---|---|---|
| -- | -- |
Mortgage History
We collect this data history from publicly available records. To have your information removed, we recommend requesting removal directly through your county’s website.
| Date | Status | Borrower | Loan Amount |
|---|---|---|---|
| Closed | $170,000 | ||
| Closed | $94,000 | ||
| Closed | $8,000 | ||
| Closed | $25,000 | ||
| Closed | $105,000 |
Tax History
We collect this data history from publicly available records. To have your information removed, we recommend requesting removal directly through your county’s website.
| Year | Tax Paid | Tax Assessment Tax Assessment Total Assessment is a certain percentage of the fair market value that is determined by local assessors to be the total taxable value of land and additions on the property. | Land | Improvement |
|---|---|---|---|---|
| 2025 | $7,210 | $452,600 | $105,600 | $347,000 |
| 2024 | $7,076 | $429,100 | $103,500 | $325,600 |
| 2023 | $6,680 | $369,700 | $89,800 | $279,900 |
| 2022 | $6,438 | $336,200 | $81,100 | $255,100 |
| 2021 | $6,054 | $318,300 | $77,300 | $241,000 |
| 2020 | $6,054 | $318,300 | $77,300 | $241,000 |
| 2019 | $5,795 | $302,600 | $79,500 | $223,100 |
| 2018 | $5,577 | $286,900 | $75,700 | $211,200 |
| 2017 | $5,321 | $274,300 | $73,000 | $201,300 |
| 2016 | $5,260 | $273,800 | $70,800 | $203,000 |
| 2015 | $5,189 | $269,700 | $70,800 | $198,900 |
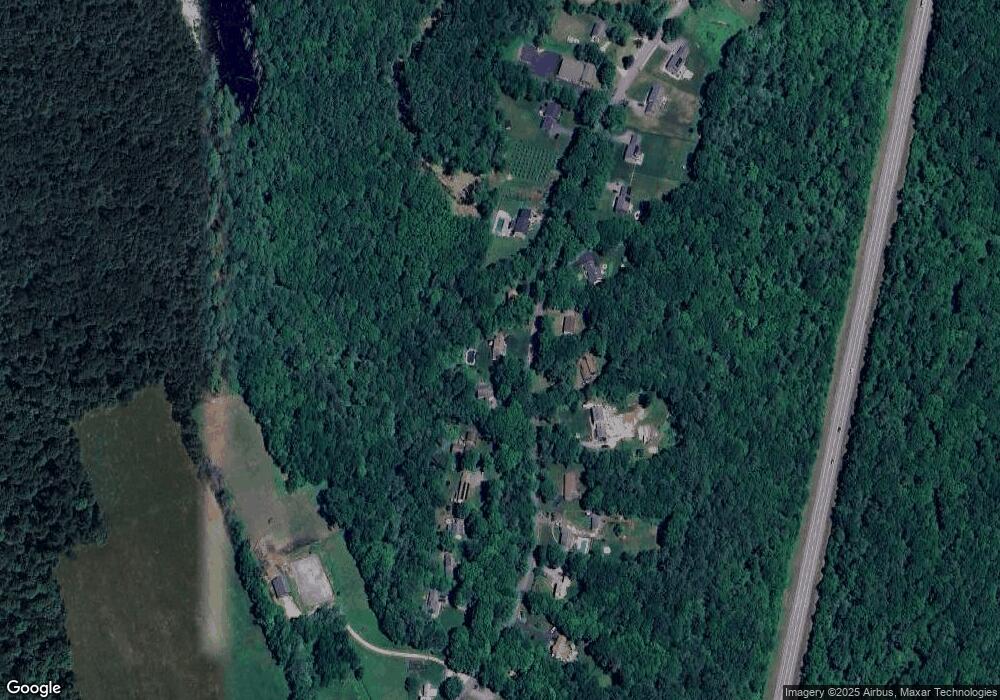
Map
- 29, 31, 33 Ladd Rd
- 473 W Sturbridge Rd
- 135 Walker Pond Rd
- 25 Casey Rd
- 47 Old Village Rd
- 104 S Shore Dr
- 5 Osgood Rd
- 0 Wildwood Rd
- Lot 0 N Sturbridge Rd
- 84 S Shore Dr
- 87 Allen Rd
- 66 Allen Rd
- 4 Cranberry Meadow Shore Rd
- 75 Allen Rd
- 23 Highfield Rd Unit C
- 6 Cranberry Meadow Shore Rd
- 183 W Sturbridge Rd
- 59 Cranberry Meadow Shore Rd
- 35 Nashoba Rd
- 1 Lane 22
Ask me questions while you tour the home.