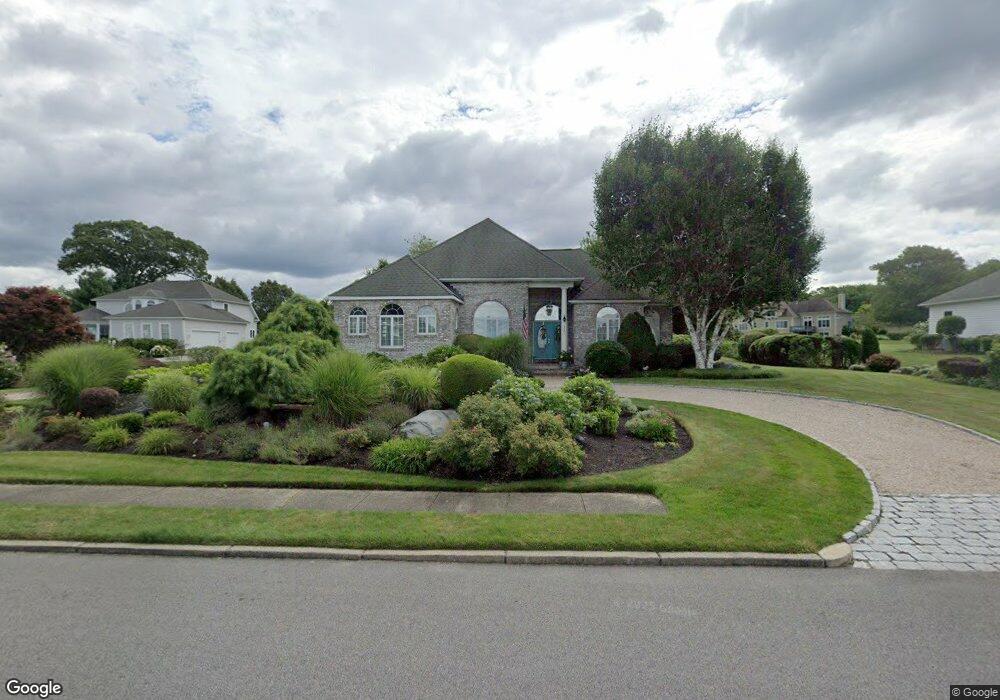
223 Channel View Warwick, RI 02889
Warwick Neck NeighborhoodEstimated Value: $1,165,000 - $1,499,000
About This Home
This home is located at 223 Channel View, Warwick, RI 02889 and is currently estimated at $1,346,900, approximately $728 per square foot. 223 Channel View is a home located in Kent County with nearby schools including Saint Kevin School and Bishop Hendricken High School.
Ownership History
We collect this data history from publicly available records. To have your information removed, we recommend requesting removal directly through your county’s website.
Purchase Details
Purchase Details
Home Values in the Area
Average Home Value in this Area
Purchase History
We collect this data history from publicly available records. To have your information removed, we recommend requesting removal directly through your county’s website.
| Date | Buyer | Sale Price | Title Company |
|---|---|---|---|
| -- | -- | ||
| $715,000 | -- |
Mortgage History
We collect this data history from publicly available records. To have your information removed, we recommend requesting removal directly through your county’s website.
| Date | Status | Borrower | Loan Amount |
|---|---|---|---|
| Previous Owner | $174,000 | ||
| Previous Owner | $195,000 | ||
| Previous Owner | $227,000 |
Tax History
We collect this data history from publicly available records. To have your information removed, we recommend requesting removal directly through your county’s website.
| Year | Tax Paid | Tax Assessment Tax Assessment Total Assessment is a certain percentage of the fair market value that is determined by local assessors to be the total taxable value of land and additions on the property. | Land | Improvement |
|---|---|---|---|---|
| 2025 | $14,887 | $1,172,200 | $648,600 | $523,600 |
| 2024 | $12,993 | $897,900 | $516,600 | $381,300 |
| 2023 | $12,741 | $897,900 | $516,600 | $381,300 |
| 2022 | $11,133 | $594,400 | $294,000 | $300,400 |
| 2021 | $11,133 | $594,400 | $294,000 | $300,400 |
| 2020 | $11,133 | $594,400 | $294,000 | $300,400 |
| 2019 | $11,133 | $594,400 | $294,000 | $300,400 |
| 2018 | $12,741 | $650,000 | $392,700 | $257,300 |
| 2017 | $13,156 | $650,000 | $392,700 | $257,300 |
| 2016 | $13,156 | $650,000 | $392,700 | $257,300 |
| 2015 | $13,560 | $653,500 | $396,600 | $256,900 |
| 2014 | $13,109 | $653,500 | $396,600 | $256,900 |
| 2013 | $12,933 | $653,500 | $396,600 | $256,900 |
Map
- 246 Channel View
- 64 Channel View Unit 4
- 22 Channel View Unit 2
- 230 Kirby Ave
- 285 Randall Ave
- 99 Blackstone Ave
- 41 Kirby Ave
- 79 Suburban Pkwy
- 77 Huron St
- 0 Quonset Ave
- 20 W View St
- 10 Progress St
- 102 Sayles Ave
- 52 Kenway Ave
- 625 Oakland Beach Ave
- 213 Ottawa Ave
- 585 Meadow View Ave
- 158 Lewiston St
- 19 Wood St Unit A
- 19 Wood St
- 209 Channel View
- 241 Channel View
- 222 Channel View
- 236 Channel View
- 225 Channel View
- 255 Channel View
- 200 Channel View
- 123 Channel View Unit 3
- 123 Channel View Unit 2
- 123 Channel View Unit 1
- 123 Channel View Unit 1103
- 123 Channel View Unit 1101
- 123 Channel View Unit 123-2
- 185 Channel View
- 201 Channel Unit A4
- 201 Channel Unit A3
- 271 Channel View
- 196 Channel View
- 103 Channel Unit 103
- 262 Channel View
Ask me questions while you tour the home.