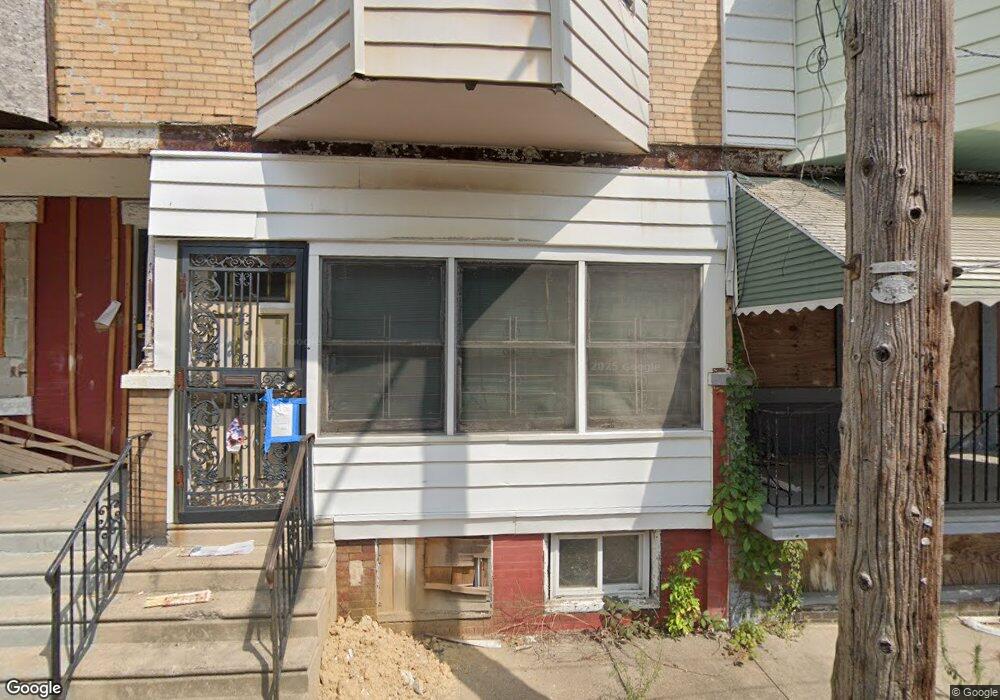
223 N Ruby St Philadelphia, PA 19139
Haddington NeighborhoodEstimated Value: $80,180 - $187,000
3
Beds
1
Bath
1,140
Sq Ft
$119/Sq Ft
Est. Value
About This Home
This home is located at 223 N Ruby St, Philadelphia, PA 19139 and is currently estimated at $135,795, approximately $119 per square foot. 223 N Ruby St is a home located in Philadelphia County with nearby schools including Overbrook High School and Global Leadership Academy Charter School Southwest.
Ownership History
Date
Name
Owned For
Owner Type
Purchase Details
Closed on
Oct 14, 2025
Sold by
Sheriff Of The County Of Philadelphia
Bought by
Souley Lareytou Leyla
Current Estimated Value
Purchase Details
Closed on
Oct 31, 2003
Sold by
Mckinnie Mikkel
Bought by
Gordon Gloria and Gordon Steven L
Purchase Details
Closed on
Sep 6, 2002
Sold by
Mellon Bank Na
Bought by
Mckinnie Mikkel
Purchase Details
Closed on
Mar 23, 2000
Sold by
Smith Pauline
Bought by
Mellon Bank Na
Create a Home Valuation Report for This Property
The Home Valuation Report is an in-depth analysis detailing your home's value as well as a comparison with similar homes in the area
Home Values in the Area
Average Home Value in this Area
Purchase History
| Date | Buyer | Sale Price | Title Company |
|---|---|---|---|
| Souley Lareytou Leyla | $10,900 | None Listed On Document | |
| Gordon Gloria | $5,000 | -- | |
| Mckinnie Mikkel | $10,500 | -- | |
| Mellon Bank Na | $6,400 | -- |
Source: Public Records
Tax History
| Year | Tax Paid | Tax Assessment Tax Assessment Total Assessment is a certain percentage of the fair market value that is determined by local assessors to be the total taxable value of land and additions on the property. | Land | Improvement |
|---|---|---|---|---|
| 2026 | $342 | $44,000 | $8,800 | $35,200 |
| 2025 | $342 | $44,000 | $8,800 | $35,200 |
| 2024 | $342 | $44,000 | $8,800 | $35,200 |
| 2023 | $342 | $24,400 | $4,880 | $19,520 |
| 2022 | $147 | $24,400 | $4,880 | $19,520 |
| 2021 | $147 | $0 | $0 | $0 |
| 2020 | $147 | $0 | $0 | $0 |
| 2019 | $143 | $0 | $0 | $0 |
| 2018 | $591 | $0 | $0 | $0 |
| 2017 | $591 | $0 | $0 | $0 |
| 2016 | $591 | $0 | $0 | $0 |
| 2015 | $784 | $0 | $0 | $0 |
| 2014 | -- | $58,500 | $3,519 | $54,981 |
| 2012 | -- | $6,048 | $832 | $5,216 |
Source: Public Records
Map
Nearby Homes
Your Personal Tour Guide
Ask me questions while you tour the home.