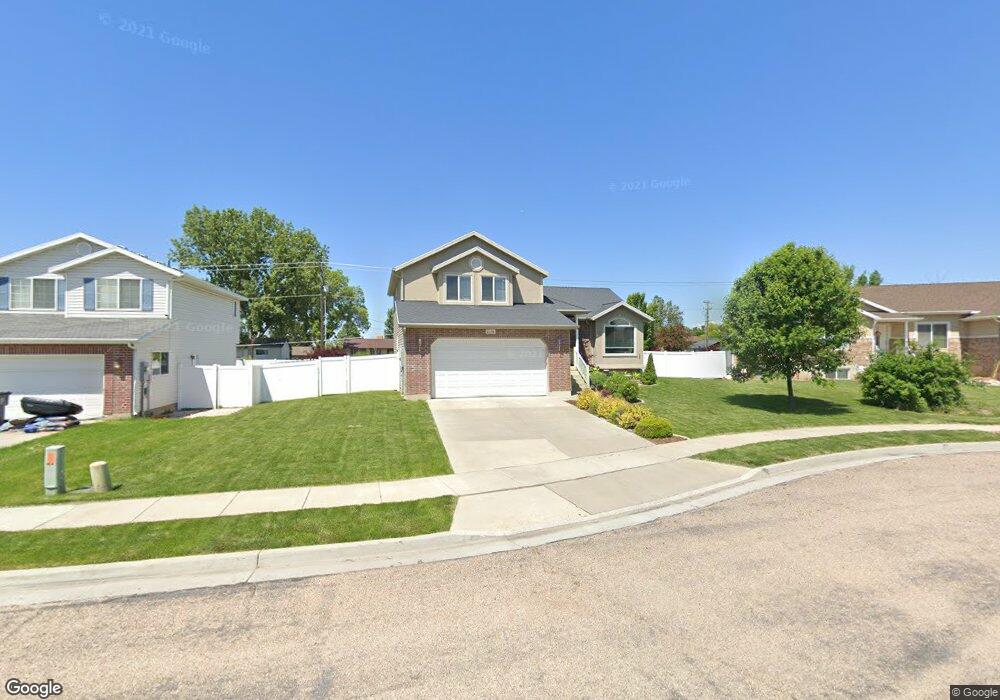
2236 S 50 E Clearfield, UT 84015
Estimated Value: $494,009 - $553,000
3
Beds
3
Baths
2,369
Sq Ft
$220/Sq Ft
Est. Value
About This Home
This home is located at 2236 S 50 E, Clearfield, UT 84015 and is currently estimated at $520,752, approximately $219 per square foot. 2236 S 50 E is a home located in Davis County with nearby schools including Antelope Elementary School, North Davis Junior High School, and Clearfield High School.
Ownership History
Date
Name
Owned For
Owner Type
Purchase Details
Closed on
May 13, 2005
Sold by
Sandlund Logan and Sandlund Kati R
Bought by
Sandlund Kati R
Current Estimated Value
Home Financials for this Owner
Home Financials are based on the most recent Mortgage that was taken out on this home.
Original Mortgage
$135,000
Outstanding Balance
$68,941
Interest Rate
5.62%
Mortgage Type
New Conventional
Estimated Equity
$451,811
Purchase Details
Closed on
Jun 24, 2004
Sold by
Nelson & Nelson Construction Inc
Bought by
Sandlund Logan and Sandlund Kati R
Purchase Details
Closed on
Oct 13, 2003
Sold by
M & D Developers Llc
Bought by
Nelson & Nelson Construction Inc
Home Financials for this Owner
Home Financials are based on the most recent Mortgage that was taken out on this home.
Original Mortgage
$127,700
Interest Rate
6.4%
Mortgage Type
Construction
Create a Home Valuation Report for This Property
The Home Valuation Report is an in-depth analysis detailing your home's value as well as a comparison with similar homes in the area
Home Values in the Area
Average Home Value in this Area
Purchase History
| Date | Buyer | Sale Price | Title Company |
|---|---|---|---|
| Sandlund Kati R | -- | Surety Title Agency | |
| Sandlund Logan | -- | Heritage West Title Insuranc | |
| Nelson & Nelson Construction Inc | -- | Heritage West Title Insuranc |
Source: Public Records
Mortgage History
| Date | Status | Borrower | Loan Amount |
|---|---|---|---|
| Open | Sandlund Kati R | $135,000 | |
| Previous Owner | Nelson & Nelson Construction Inc | $127,700 |
Source: Public Records
Tax History
| Year | Tax Paid | Tax Assessment Tax Assessment Total Assessment is a certain percentage of the fair market value that is determined by local assessors to be the total taxable value of land and additions on the property. | Land | Improvement |
|---|---|---|---|---|
| 2025 | $2,829 | $253,550 | $75,188 | $178,362 |
| 2024 | $2,754 | $248,600 | $71,862 | $176,738 |
| 2023 | $2,523 | $418,000 | $114,709 | $303,291 |
| 2022 | $2,878 | $257,950 | $65,418 | $192,532 |
| 2021 | $2,585 | $350,000 | $71,012 | $278,988 |
| 2020 | $2,246 | $302,000 | $59,995 | $242,005 |
| 2019 | $2,170 | $288,000 | $61,869 | $226,131 |
| 2018 | $2,042 | $264,000 | $54,915 | $209,085 |
| 2016 | $1,780 | $120,340 | $22,033 | $98,307 |
| 2015 | $1,703 | $109,780 | $22,033 | $87,747 |
| 2014 | $1,621 | $105,922 | $22,033 | $83,889 |
| 2013 | -- | $101,493 | $29,480 | $72,013 |
Source: Public Records
Map
Nearby Homes
- 2345 S Main St
- 195 E 2325 S
- 2480 S Main St
- 1250 N 2925 W
- 3250 W 1075 N
- 369 W 1900 S
- 3389 W Gordon Ave
- 1685 S 245 W
- 1969 S 575 E
- 460 E 1700 S Unit 1 & 2
- 1877 S 725 E
- 1186 N 2425 W
- 816 N 2700 W
- 906 E Sam Cir
- 1141 N 2275 W
- 907 W 1840 S Unit C
- 929 W 1920 S Unit A
- 961 1910 S
- 921 W 2700 S
- 1876 W 1575 N Unit 237
Your Personal Tour Guide
Ask me questions while you tour the home.