2245 S Clermont St Denver, CO 80222
University Hills NeighborhoodEstimated Value: $603,000 - $707,000
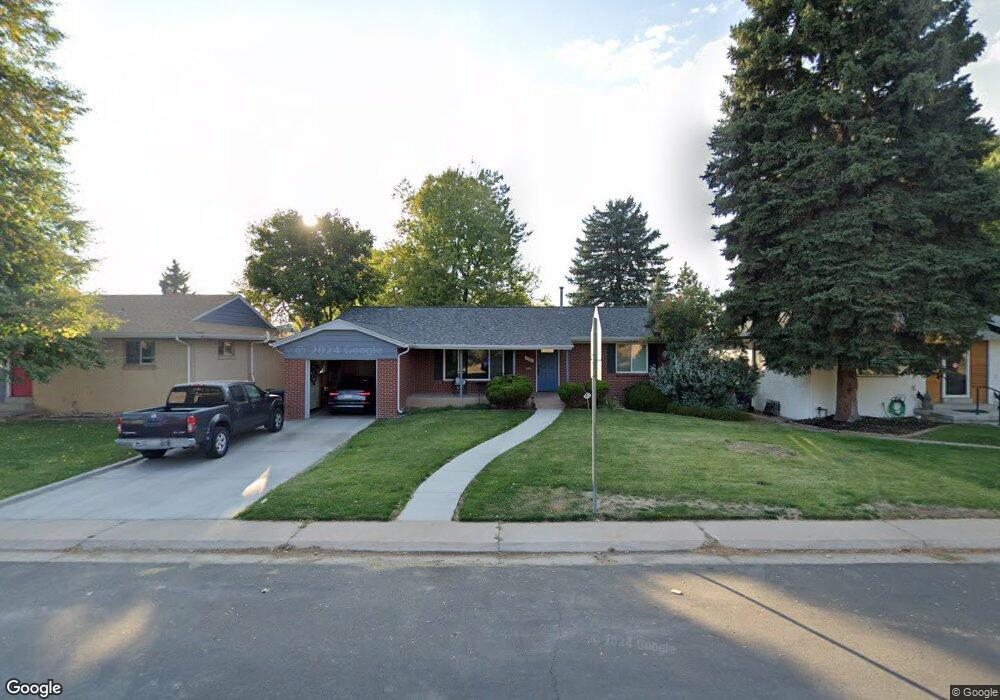
About This Home
This home is located at 2245 S Clermont St, Denver, CO 80222 and is currently estimated at $663,330, approximately $256 per square foot. 2245 S Clermont St is a home located in Denver County with nearby schools including University Park Elementary School, Merrill Middle School, and Thomas Jefferson High School.
Ownership History
We collect this data history from publicly available records. To have your information removed, we recommend requesting removal directly through your county’s website.
Purchase Details
Purchase Details
Home Financials for this Owner
Home Financials are based on the most recent Mortgage that was taken out on this home.Purchase Details
Home Financials for this Owner
Home Financials are based on the most recent Mortgage that was taken out on this home.Purchase Details
Purchase Details
Purchase Details
Home Financials for this Owner
Home Financials are based on the most recent Mortgage that was taken out on this home.Purchase Details
Home Financials for this Owner
Home Financials are based on the most recent Mortgage that was taken out on this home.Purchase Details
Home Financials for this Owner
Home Financials are based on the most recent Mortgage that was taken out on this home.Purchase Details
Home Financials for this Owner
Home Financials are based on the most recent Mortgage that was taken out on this home.Purchase Details
Purchase Details
Home Financials for this Owner
Home Financials are based on the most recent Mortgage that was taken out on this home.Home Values in the Area
Average Home Value in this Area
Purchase History
We collect this data history from publicly available records. To have your information removed, we recommend requesting removal directly through your county’s website.
| Date | Buyer | Sale Price | Title Company |
|---|---|---|---|
| -- | None Listed On Document | ||
| $420,100 | Land Title Guarantee | ||
| $216,000 | None Available | ||
| $261,161 | None Available | ||
| -- | None Available | ||
| $255,000 | Stewart Title Of Denver Inc | ||
| $240,500 | Stewart Title | ||
| $230,000 | Stewart Title | ||
| $20,000 | -- | ||
| -- | -- | ||
| $125,000 | Commonwealth Land Title |
Mortgage History
We collect this data history from publicly available records. To have your information removed, we recommend requesting removal directly through your county’s website.
| Date | Status | Borrower | Loan Amount |
|---|---|---|---|
| Previous Owner | $374,850 | ||
| Previous Owner | $194,400 | ||
| Previous Owner | $251,447 | ||
| Previous Owner | $237,149 | ||
| Previous Owner | $184,000 | ||
| Previous Owner | $100,000 | ||
| Closed | $34,500 |
Tax History
We collect this data history from publicly available records. To have your information removed, we recommend requesting removal directly through your county’s website.
| Year | Tax Paid | Tax Assessment Tax Assessment Total Assessment is a certain percentage of the fair market value that is determined by local assessors to be the total taxable value of land and additions on the property. | Land | Improvement |
|---|---|---|---|---|
| 2025 | $3,479 | $45,480 | $19,940 | $19,940 |
| 2024 | $3,202 | $40,430 | $15,260 | $25,170 |
| 2023 | $3,133 | $40,430 | $15,260 | $25,170 |
| 2022 | $3,046 | $38,300 | $19,650 | $18,650 |
| 2021 | $2,940 | $39,400 | $20,220 | $19,180 |
| 2020 | $2,491 | $33,580 | $20,220 | $13,360 |
| 2019 | $2,422 | $33,580 | $20,220 | $13,360 |
| 2018 | $2,357 | $30,470 | $7,640 | $22,830 |
| 2017 | $2,350 | $30,470 | $7,640 | $22,830 |
| 2016 | $2,231 | $27,360 | $7,880 | $19,480 |
| 2015 | $1,967 | $25,180 | $7,880 | $17,300 |
| 2014 | $1,278 | $15,390 | $7,880 | $7,510 |
Map
- 2216 S Clermont St
- 2190 S Birch St
- 4475 E Warren Ave
- 2201 S Dexter St
- 4205 E Iliff Ave Unit 1
- 4731 E Iliff Ave
- 3362 S Albion St
- 4600 E Asbury Cir Unit 110
- 4600 E Asbury Cir Unit 309
- 3910 E Jerome Ave
- 4251 E Harvard Ave
- 2321 S Henry Place
- 2510 S Cherry St
- 4860 E Harvard Ln
- 1971 S Dahlia St
- 4395 E Jewell Ave Unit 5
- 4740 E Jewell Ave
- 4400 E Bails Place
- 4701 E Jewell Ave
- 2500 S Jackson St
- 2253 S Clermont St
- 2255 S Clermont St
- 2235 S Clermont St
- 2265 S Clermont St
- 2225 S Clermont St
- 2250 S Birch St
- 2240 S Birch St
- 2232 S Clermont St
- 2260 S Birch St
- 2226 S Clermont St
- 2240 S Clermont St
- 2230 S Birch St
- 2215 S Clermont St
- 2250 S Clermont St
- 2220 S Birch St
- 2270 S Birch St
- 2270 S Clermont St
- 2205 S Clermont St
- 2208 S Clermont St
- 4415 E Iliff Ave
Ask me questions while you tour the home.