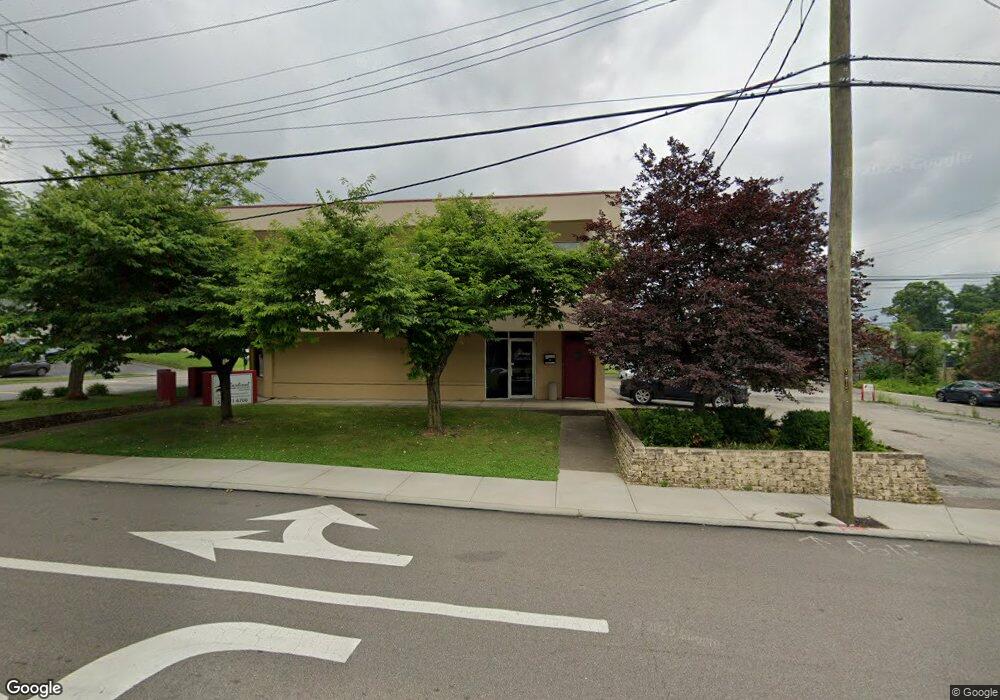
2248 Losantiville Ave Cincinnati, OH 45237
Studio
--
Bath
6,522
Sq Ft
9,148
Sq Ft Lot
About This Home
This home is located at 2248 Losantiville Ave, Cincinnati, OH 45237. 2248 Losantiville Ave is a home located in Hamilton County with nearby schools including Pleasant Ridge Montessori School, Shroder High School, and Clark Montessori High School.
Ownership History
Date
Name
Owned For
Owner Type
Purchase Details
Closed on
May 23, 2024
Sold by
Hendrickson Dale A and Cook Robert G
Bought by
Cardinal Home Healthcare Solutions Inc
Purchase Details
Closed on
Jun 9, 2009
Sold by
States Resources Corp
Bought by
Hendrickson Dale
Home Financials for this Owner
Home Financials are based on the most recent Mortgage that was taken out on this home.
Original Mortgage
$100,000
Interest Rate
4.85%
Mortgage Type
Seller Take Back
Purchase Details
Closed on
Sep 30, 2003
Sold by
Boymel Sam
Bought by
Turner Mark A
Home Financials for this Owner
Home Financials are based on the most recent Mortgage that was taken out on this home.
Original Mortgage
$215,600
Interest Rate
6.43%
Mortgage Type
Commercial
Purchase Details
Closed on
Apr 16, 1999
Sold by
Star Bank National Assn
Bought by
Boymel Sam
Create a Home Valuation Report for This Property
The Home Valuation Report is an in-depth analysis detailing your home's value as well as a comparison with similar homes in the area
Home Values in the Area
Average Home Value in this Area
Purchase History
| Date | Buyer | Sale Price | Title Company |
|---|---|---|---|
| Cardinal Home Healthcare Solutions Inc | $50,000 | None Listed On Document | |
| Hendrickson Dale | $180,000 | None Available | |
| Turner Mark A | $200,000 | -- | |
| Boymel Sam | $100,000 | -- |
Source: Public Records
Mortgage History
| Date | Status | Borrower | Loan Amount |
|---|---|---|---|
| Previous Owner | Hendrickson Dale | $100,000 | |
| Previous Owner | Turner Mark A | $215,600 |
Source: Public Records
Tax History
| Year | Tax Paid | Tax Assessment Tax Assessment Total Assessment is a certain percentage of the fair market value that is determined by local assessors to be the total taxable value of land and additions on the property. | Land | Improvement |
|---|---|---|---|---|
| 2025 | $6,248 | $63,739 | $17,647 | $46,092 |
| 2024 | $6,213 | $63,739 | $17,647 | $46,092 |
| 2023 | $6,195 | $63,739 | $17,647 | $46,092 |
| 2022 | $6,211 | $53,596 | $16,324 | $37,272 |
| 2021 | $6,273 | $53,596 | $16,324 | $37,272 |
| 2020 | $6,214 | $53,596 | $16,324 | $37,272 |
| 2019 | $6,473 | $50,089 | $15,257 | $34,832 |
| 2018 | $6,374 | $50,089 | $15,257 | $34,832 |
| 2017 | $6,163 | $50,089 | $15,257 | $34,832 |
| 2016 | $6,216 | $48,839 | $15,484 | $33,355 |
| 2015 | $5,834 | $48,839 | $15,484 | $33,355 |
| 2014 | $5,598 | $48,839 | $15,484 | $33,355 |
| 2013 | $5,813 | $50,873 | $16,128 | $34,745 |
Source: Public Records
Map
Nearby Homes
- 6419 Stover Ave
- 2344 Losantiville Ave
- 6402 Mayflower Ave
- 6424 Graceland Ave
- 6750 Elbrook Ave
- 6771 Elbrook Ave
- 2436 Bremont Ave
- 7119 Eastlawn Dr
- 2507 Kellerman Ave
- 6211 Mayflower Ave
- 2526 Bremont Ave
- 6110 Stover Ave
- 2537 Vera Ave
- 2539 Vera Ave
- 2541 Vera Ave
- 2543 Vera Ave
- 2652 Cedarbrook Dr
- 6025 Mayflower Ave
- 2364 Langdon Farm Rd
- 2063 E Seymour Ave
- 6511 Elbrook Ave
- 2290 Losantiville Ave
- 12345 Testaddress
- 2308 Losantiville Ave
- 2301 Losantiville Ave
- 2309 Vera Ave
- 2310 Losantiville Ave
- 6519 Elbrook Ave
- 2237 Losantiville Ave
- 2305 Losantiville Ave
- 2313 Vera Ave
- 2235 Losantiville Ave
- 2314 Losantiville Ave
- 2316 Losantiville Ave
- 2307 Losantiville Ave
- 6523 Elbrook Ave
- 6467 Elbrook Ave
- 2317 Vera Ave
- 6470 Stover Ave
- 2318 Losantiville Ave
Your Personal Tour Guide
Ask me questions while you tour the home.