225 Beattie St Fall River, MA 02723
Oak Grove Village NeighborhoodEstimated Value: $401,696 - $516,000
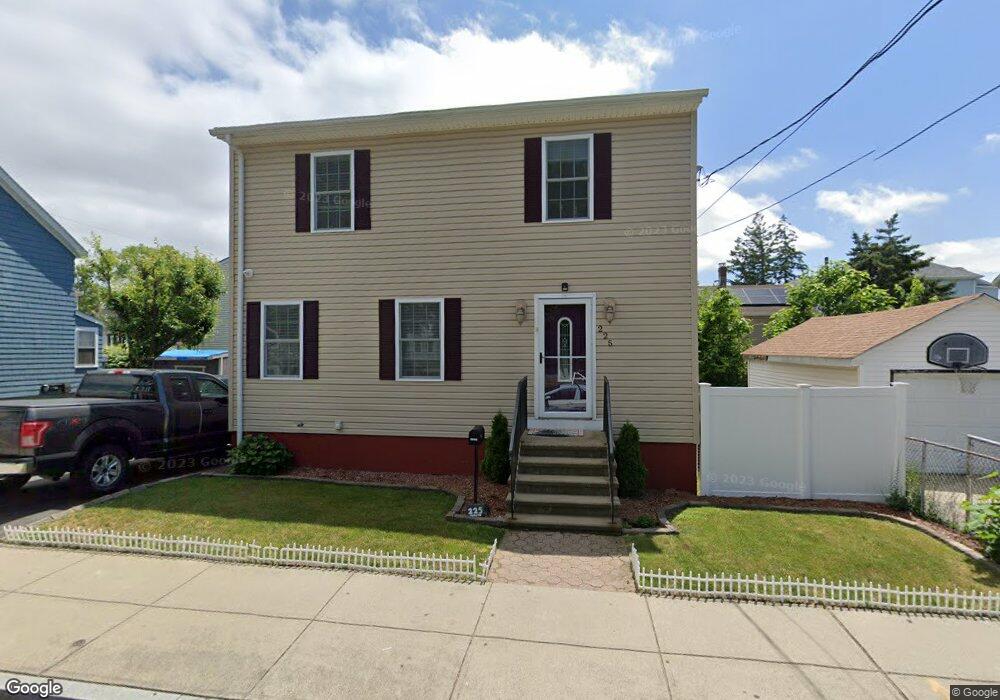
About This Home
This home is located at 225 Beattie St, Fall River, MA 02723 and is currently estimated at $442,924, approximately $272 per square foot. 225 Beattie St is a home located in Bristol County with nearby schools including Mary Fonseca Elementary School, Talbot Innovation School, and B M C Durfee High School.
Ownership History
We collect this data history from publicly available records. To have your information removed, we recommend requesting removal directly through your county’s website.
Purchase Details
Home Financials for this Owner
Home Financials are based on the most recent Mortgage that was taken out on this home.Purchase Details
Home Values in the Area
Average Home Value in this Area
Purchase History
We collect this data history from publicly available records. To have your information removed, we recommend requesting removal directly through your county’s website.
| Date | Buyer | Sale Price | Title Company |
|---|---|---|---|
| $232,500 | -- | ||
| $62,500 | -- |
Mortgage History
We collect this data history from publicly available records. To have your information removed, we recommend requesting removal directly through your county’s website.
| Date | Status | Borrower | Loan Amount |
|---|---|---|---|
| Open | $225,525 |
Tax History
We collect this data history from publicly available records. To have your information removed, we recommend requesting removal directly through your county’s website.
| Year | Tax Paid | Tax Assessment Tax Assessment Total Assessment is a certain percentage of the fair market value that is determined by local assessors to be the total taxable value of land and additions on the property. | Land | Improvement |
|---|---|---|---|---|
| 2025 | $3,845 | $335,800 | $122,900 | $212,900 |
| 2024 | $3,603 | $313,600 | $118,300 | $195,300 |
| 2023 | $3,609 | $294,100 | $101,400 | $192,700 |
| 2022 | $3,055 | $251,000 | $92,200 | $158,800 |
| 2021 | $3,055 | $220,900 | $85,300 | $135,600 |
| 2020 | $3,008 | $208,200 | $81,600 | $126,600 |
| 2019 | $2,901 | $199,000 | $77,700 | $121,300 |
| 2018 | $2,775 | $189,800 | $76,300 | $113,500 |
| 2017 | $2,649 | $189,200 | $77,800 | $111,400 |
| 2016 | $2,526 | $185,300 | $81,100 | $104,200 |
| 2015 | $2,418 | $184,900 | $78,100 | $106,800 |
| 2014 | $2,378 | $189,000 | $82,200 | $106,800 |
Map
- 1124 Bedford St
- 235 Chavenson St
- 14 Downing St
- 1017 Pine St
- 178 County St
- 6 N Rocliffe St
- 49 Downing St
- 124 Downing St
- 120 15th St Unit 4
- 357 County St
- 367 County St
- 349 County St
- 119-121 Tremont St
- 90 Tremont St
- 70 Jencks St
- 847 Pleasant St
- 1155-1157 Pleasant St
- 166 Stonehaven Rd
- 131 Thomas St
- 153 Jencks St
- 181 Beattie St
- 64 Johnson St
- 50 Johnson St
- 52 Johnson St Unit 3
- 52 Johnson St
- 180 Beattie St
- 67 Stinziano St
- 53 Stinziano St
- 166 Beattie St
- 166 Beattie St Unit 3
- 166 Beattie St Unit 1
- 166 Beattie St Unit 1ST
- 44 Johnson St
- 44 Johnson St Unit 8
- 44 Johnson St Unit 7
- 44 Johnson St Unit 6
- 44 Johnson St Unit 5
- 44 Johnson St Unit 4
- 44 Johnson St Unit 3
- 44 Johnson St Unit 2
Ask me questions while you tour the home.