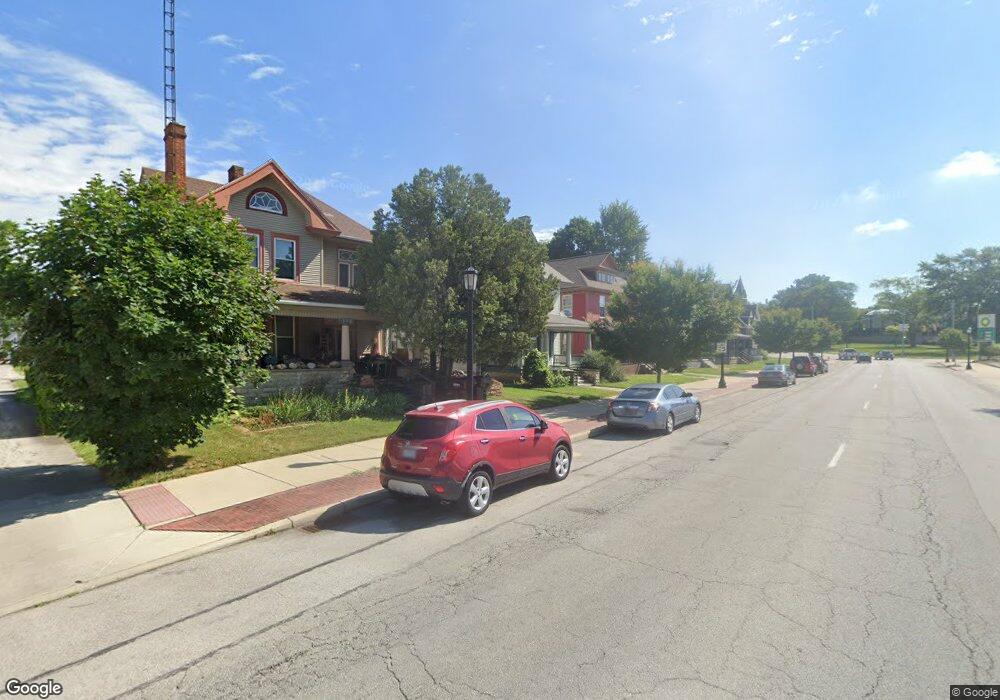
225 E Market St Tiffin, OH 44883
Estimated Value: $152,000 - $169,000
4
Beds
2
Baths
1,750
Sq Ft
$92/Sq Ft
Est. Value
About This Home
This home is located at 225 E Market St, Tiffin, OH 44883 and is currently estimated at $161,407, approximately $92 per square foot. 225 E Market St is a home located in Seneca County with nearby schools including Columbian High School, Calvert High School, and Calvert Catholic Elementary School.
Ownership History
Date
Name
Owned For
Owner Type
Purchase Details
Closed on
Jun 28, 2002
Sold by
Tran Bryan K
Bought by
Moore Cynthia
Current Estimated Value
Purchase Details
Closed on
Aug 24, 2001
Sold by
Williams Thomas E
Bought by
Williams Thomas E
Purchase Details
Closed on
Jul 26, 2000
Sold by
Williams Girtrue
Bought by
Williams Girtrue Le/Te & Tr
Purchase Details
Closed on
Jul 21, 2000
Sold by
Williams Girtrue
Bought by
Williams Girtrue Le/Te & Tr
Create a Home Valuation Report for This Property
The Home Valuation Report is an in-depth analysis detailing your home's value as well as a comparison with similar homes in the area
Home Values in the Area
Average Home Value in this Area
Purchase History
| Date | Buyer | Sale Price | Title Company |
|---|---|---|---|
| Moore Cynthia | $72,500 | -- | |
| Williams Thomas E | -- | -- | |
| Williams Girtrue Le/Te & Tr | -- | -- | |
| Williams Girtrue Le/Te & Tr | -- | -- |
Source: Public Records
Tax History
| Year | Tax Paid | Tax Assessment Tax Assessment Total Assessment is a certain percentage of the fair market value that is determined by local assessors to be the total taxable value of land and additions on the property. | Land | Improvement |
|---|---|---|---|---|
| 2025 | $1,538 | $44,290 | $4,420 | $39,870 |
| 2024 | $1,495 | $44,290 | $4,420 | $39,870 |
| 2023 | $1,497 | $44,290 | $4,420 | $39,870 |
| 2022 | $1,344 | $33,010 | $3,760 | $29,250 |
| 2021 | $1,354 | $33,010 | $3,760 | $29,250 |
| 2020 | $1,379 | $33,009 | $3,759 | $29,250 |
| 2019 | $1,545 | $31,602 | $3,686 | $27,916 |
| 2018 | $1,368 | $31,602 | $3,686 | $27,916 |
| 2017 | $1,307 | $31,602 | $3,686 | $27,916 |
| 2016 | $1,244 | $29,163 | $3,574 | $25,589 |
| 2015 | $1,230 | $29,163 | $3,574 | $25,589 |
| 2014 | $1,159 | $29,163 | $3,574 | $25,589 |
| 2013 | $1,239 | $30,052 | $3,686 | $26,366 |
Source: Public Records
Map
Nearby Homes
Your Personal Tour Guide
Ask me questions while you tour the home.