225 Riley St Lansing, MI 48910
Greencroft Park NeighborhoodEstimated Value: $126,552 - $146,000
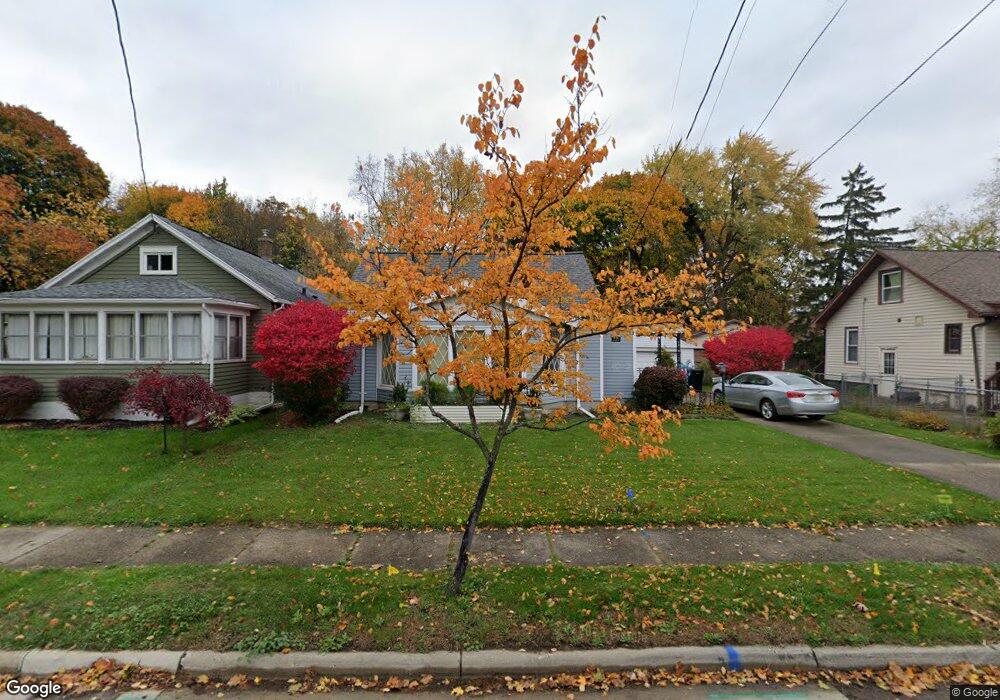
About This Home
This home is located at 225 Riley St, Lansing, MI 48910 and is currently estimated at $138,138, approximately $142 per square foot. 225 Riley St is a home located in Ingham County with nearby schools including Lyons Elementary School, Attwood School, and Everett High School.
Ownership History
We collect this data history from publicly available records. To have your information removed, we recommend requesting removal directly through your county’s website.
Purchase Details
Home Financials for this Owner
Home Financials are based on the most recent Mortgage that was taken out on this home.Purchase Details
Home Values in the Area
Average Home Value in this Area
Purchase History
We collect this data history from publicly available records. To have your information removed, we recommend requesting removal directly through your county’s website.
| Date | Buyer | Sale Price | Title Company |
|---|---|---|---|
| $72,900 | -- | ||
| $53,000 | -- |
Mortgage History
We collect this data history from publicly available records. To have your information removed, we recommend requesting removal directly through your county’s website.
| Date | Status | Borrower | Loan Amount |
|---|---|---|---|
| Open | $72,850 |
Tax History
We collect this data history from publicly available records. To have your information removed, we recommend requesting removal directly through your county’s website.
| Year | Tax Paid | Tax Assessment Tax Assessment Total Assessment is a certain percentage of the fair market value that is determined by local assessors to be the total taxable value of land and additions on the property. | Land | Improvement |
|---|---|---|---|---|
| 2025 | $2,003 | $61,400 | $10,500 | $50,900 |
| 2024 | $19 | $55,400 | $10,500 | $44,900 |
| 2023 | $2,323 | $50,800 | $10,500 | $40,300 |
| 2022 | $2,096 | $45,300 | $6,700 | $38,600 |
| 2021 | $2,052 | $41,800 | $5,700 | $36,100 |
| 2020 | $2,039 | $40,000 | $5,700 | $34,300 |
| 2019 | $1,954 | $36,300 | $5,700 | $30,600 |
| 2018 | $1,832 | $32,000 | $5,700 | $26,300 |
| 2017 | $1,754 | $32,000 | $5,700 | $26,300 |
| 2016 | $1,677 | $31,400 | $5,700 | $25,700 |
| 2015 | $1,677 | $30,000 | $11,384 | $18,616 |
| 2014 | $1,677 | $29,400 | $9,287 | $20,113 |
Map
- 2229 Forest Ave
- 531 Pacific Ave
- 2316 Forest Ave
- 307 E Mount Hope Ave
- 311 E Mount Hope Ave
- 315 E Mount Hope Ave
- 219 E Mount Hope Ave
- 2226 Strathmore Rd
- 1807 Teel Ave
- 525 E Mount Hope Ave
- 1729 Maplewood Ave
- 311 Norman St
- 2217 Grant St
- 1731 Herbert St
- 1724 Maplewood Ave
- 312 W Rockford Rd
- 2600 Maplewood Ave
- 201 Strathmore Rd
- 2609 Maplewood Ave
- 408 Isbell St
Ask me questions while you tour the home.