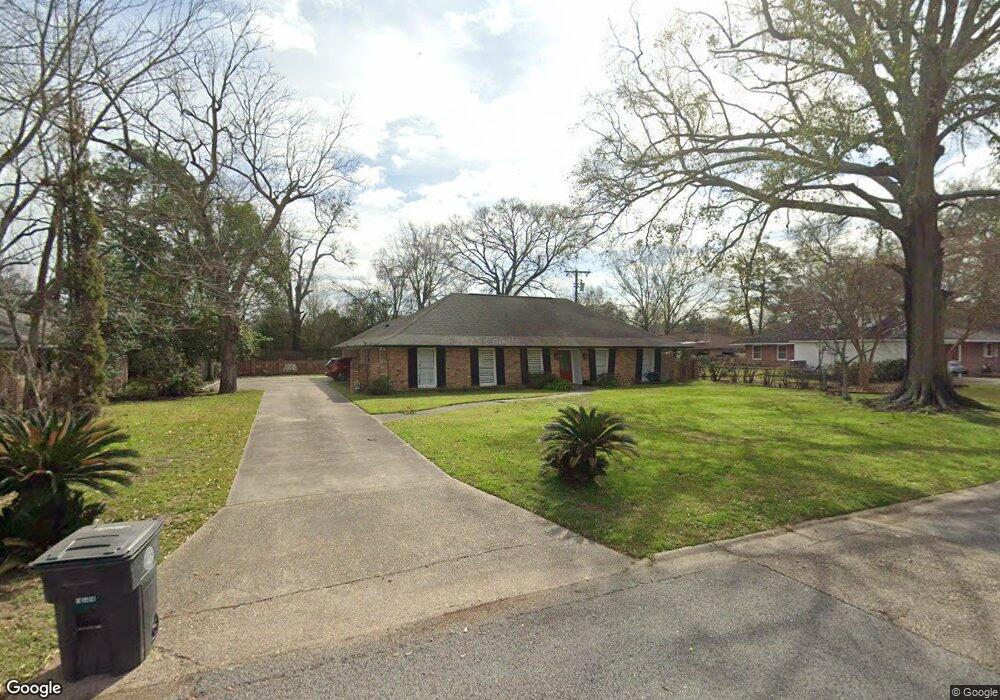
2267 Duncan Dr Baton Rouge, LA 70802
Highlands/Perkins NeighborhoodEstimated Value: $172,577 - $305,000
Studio
--
Bath
2,547
Sq Ft
$84/Sq Ft
Est. Value
About This Home
This home is located at 2267 Duncan Dr, Baton Rouge, LA 70802 and is currently estimated at $215,144, approximately $84 per square foot. 2267 Duncan Dr is a home located in East Baton Rouge Parish with nearby schools including Glasgow Middle School, McKinley Senior High School, and St. Francis Xavier School.
Ownership History
Date
Name
Owned For
Owner Type
Purchase Details
Closed on
Dec 28, 2022
Sold by
Cc River District Llc
Bought by
Sg Br West Llc
Current Estimated Value
Purchase Details
Closed on
Sep 6, 2022
Sold by
Brown Loren M
Bought by
Brown Loren M
Home Financials for this Owner
Home Financials are based on the most recent Mortgage that was taken out on this home.
Original Mortgage
$156,000
Interest Rate
5.3%
Mortgage Type
New Conventional
Purchase Details
Closed on
Jul 2, 2022
Sold by
Cunningham Billie Delpit
Bought by
Brown Loren M
Create a Home Valuation Report for This Property
The Home Valuation Report is an in-depth analysis detailing your home's value as well as a comparison with similar homes in the area
Home Values in the Area
Average Home Value in this Area
Purchase History
| Date | Buyer | Sale Price | Title Company |
|---|---|---|---|
| Sg Br West Llc | $3,022,905 | None Listed On Document | |
| Brown Loren M | $156,000 | -- | |
| Brown Loren M | -- | -- |
Source: Public Records
Mortgage History
| Date | Status | Borrower | Loan Amount |
|---|---|---|---|
| Previous Owner | Brown Loren M | $156,000 |
Source: Public Records
Tax History
| Year | Tax Paid | Tax Assessment Tax Assessment Total Assessment is a certain percentage of the fair market value that is determined by local assessors to be the total taxable value of land and additions on the property. | Land | Improvement |
|---|---|---|---|---|
| 2024 | $1,869 | $14,820 | $550 | $14,270 |
| 2023 | $1,788 | $14,820 | $550 | $14,270 |
| 2022 | $1,258 | $10,230 | $550 | $9,680 |
| 2021 | $1,230 | $10,230 | $550 | $9,680 |
| 2020 | $1,218 | $10,230 | $550 | $9,680 |
| 2019 | $1,159 | $9,300 | $500 | $8,800 |
| 2018 | $1,145 | $9,300 | $500 | $8,800 |
| 2017 | $1,145 | $9,300 | $500 | $8,800 |
| 2016 | $313 | $9,300 | $500 | $8,800 |
| 2015 | $76 | $5,800 | $500 | $5,300 |
| 2014 | $76 | $5,800 | $500 | $5,300 |
| 2013 | -- | $5,800 | $500 | $5,300 |
Source: Public Records
Map
Nearby Homes
Your Personal Tour Guide
Ask me questions while you tour the home.