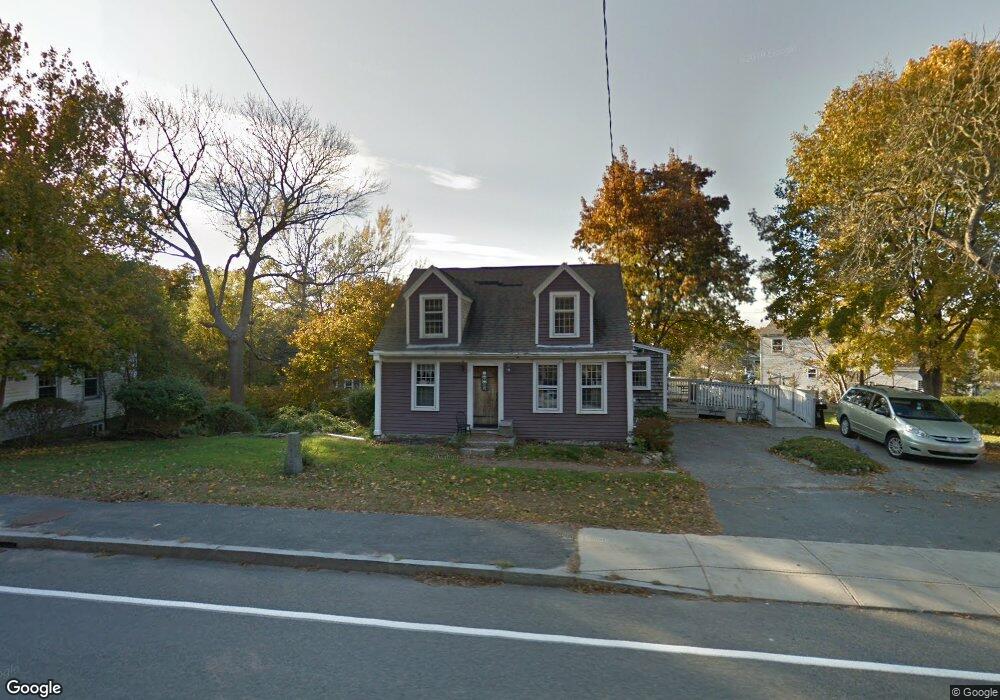
228 Hull St Hingham, MA 02043
Estimated Value: $729,000 - $998,000
About This Home
This home is located at 228 Hull St, Hingham, MA 02043 and is currently estimated at $861,335, approximately $428 per square foot. 228 Hull St is a home located in Plymouth County with nearby schools including East Elementary School, Hingham Middle School, and Hingham High School.
Ownership History
We collect this data history from publicly available records. To have your information removed, we recommend requesting removal directly through your county’s website.
Purchase Details
Purchase History
We collect this data history from publicly available records. To have your information removed, we recommend requesting removal directly through your county’s website.
| Date | Buyer | Sale Price | Title Company |
|---|---|---|---|
| $90,000 | -- |
Mortgage History
We collect this data history from publicly available records. To have your information removed, we recommend requesting removal directly through your county’s website.
| Date | Status | Borrower | Loan Amount |
|---|---|---|---|
| Open | $210,000 | ||
| Closed | $100,000 | ||
| Closed | $47,000 | ||
| Closed | $12,000 |
Tax History
We collect this data history from publicly available records. To have your information removed, we recommend requesting removal directly through your county’s website.
| Year | Tax Paid | Tax Assessment Tax Assessment Total Assessment is a certain percentage of the fair market value that is determined by local assessors to be the total taxable value of land and additions on the property. | Land | Improvement |
|---|---|---|---|---|
| 2025 | $7,582 | $709,300 | $325,800 | $383,500 |
| 2024 | $7,602 | $700,600 | $325,800 | $374,800 |
| 2023 | $6,651 | $665,100 | $302,500 | $362,600 |
| 2022 | $6,531 | $565,000 | $263,700 | $301,300 |
| 2021 | $6,522 | $552,700 | $263,700 | $289,000 |
| 2020 | $6,414 | $556,300 | $263,700 | $292,600 |
| 2019 | $6,507 | $551,000 | $263,700 | $287,300 |
| 2018 | $6,568 | $542,300 | $263,700 | $278,600 |
| 2017 | $6,184 | $504,800 | $264,500 | $240,300 |
| 2016 | $6,149 | $492,300 | $252,000 | $240,300 |
| 2015 | $5,804 | $463,200 | $222,900 | $240,300 |
Map
- 792 Jerusalem Rd
- 26 Lamberts Ln
- 28 Lamberts Ln
- 26 School St Unit 7
- 26 School St Unit 206
- 26 School St Unit 212
- 24 School St Unit A
- 9 Shore Garden Rd
- 94 Nantasket Ave
- 30 Diab Ln Unit 8
- 0 Seaview Ave
- 23 Wyola Rd
- 9 Meade Ave Unit 1
- 22 Wyola Rd
- 120 Nantasket Ave Unit 301
- 120 Nantasket Ave Unit 204
- 120 Nantasket Ave Unit 304
- 120 Nantasket Ave Unit 307
- 120 Nantasket Ave Unit PH5
- 120 Nantasket Ave Unit 201
- 224 Hull St
- 232 Hull St
- 331 Rockland St
- 329 Rockland St
- 335 Rockland St
- 335 Rockland St Unit 1st Floor
- 234 Hull St
- 234 Hull St Unit 2
- 234 Hull St Unit 1
- 323 Rockland St
- 218 Hull St
- 337 Rockland St
- 2 Grace Dr
- 4 Grace Dr
- 4 Grace Dr
- 216 Hull St
- 334 Rockland St
- 238 Hull St
- 328 Rockland St
- 326 Rockland St
Ask me questions while you tour the home.