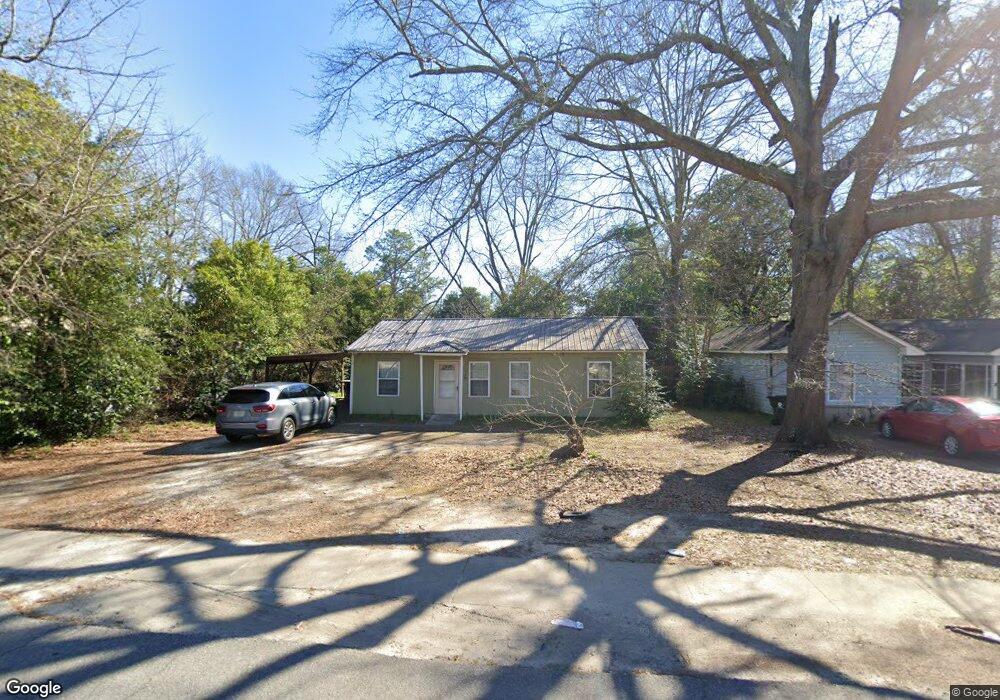
228 Johns Rd Warner Robins, GA 31093
Estimated Value: $60,000 - $99,000
3
Beds
1
Bath
888
Sq Ft
$94/Sq Ft
Est. Value
About This Home
This home is located at 228 Johns Rd, Warner Robins, GA 31093 and is currently estimated at $83,525, approximately $94 per square foot. 228 Johns Rd is a home located in Houston County with nearby schools including Parkwood Elementary School, Northside Middle School, and Northside High School.
Ownership History
Date
Name
Owned For
Owner Type
Purchase Details
Closed on
Jan 26, 2021
Sold by
Regis Elie
Bought by
Capi Homes Llc
Current Estimated Value
Purchase Details
Closed on
Oct 15, 2020
Sold by
Capi Homes Llc
Bought by
Regis Elie
Purchase Details
Closed on
Aug 24, 2018
Sold by
Green C Eston
Bought by
Capi Homes Llc
Purchase Details
Closed on
Nov 25, 2009
Sold by
Green Mildred B
Bought by
Green C Eston
Purchase Details
Closed on
Feb 18, 1967
Sold by
Ivester J C
Bought by
Green Mildred B
Purchase Details
Closed on
Oct 11, 1963
Bought by
Ivester J C
Create a Home Valuation Report for This Property
The Home Valuation Report is an in-depth analysis detailing your home's value as well as a comparison with similar homes in the area
Home Values in the Area
Average Home Value in this Area
Purchase History
We collect this data history from publicly available records. To have your information removed, we recommend requesting removal directly through your county’s website.
| Date | Buyer | Sale Price | Title Company |
|---|---|---|---|
| Capi Homes Llc | -- | None Available | |
| Regis Elie | -- | None Available | |
| Capi Homes Llc | $10,000 | None Available | |
| Green C Eston | -- | None Available | |
| Green Mildred B | -- | -- | |
| Ivester J C | -- | -- |
Source: Public Records
Tax History
| Year | Tax Paid | Tax Assessment Tax Assessment Total Assessment is a certain percentage of the fair market value that is determined by local assessors to be the total taxable value of land and additions on the property. | Land | Improvement |
|---|---|---|---|---|
| 2025 | $558 | $19,160 | $6,000 | $13,160 |
| 2024 | $579 | $17,680 | $5,000 | $12,680 |
| 2023 | $435 | $13,200 | $2,600 | $10,600 |
| 2022 | $233 | $10,120 | $2,600 | $7,520 |
| 2021 | $213 | $9,200 | $2,600 | $6,600 |
| 2020 | $165 | $7,120 | $2,600 | $4,520 |
| 2019 | $93 | $7,120 | $2,600 | $4,520 |
| 2018 | $165 | $7,120 | $2,600 | $4,520 |
| 2017 | $166 | $7,120 | $2,600 | $4,520 |
| 2016 | $166 | $7,120 | $2,600 | $4,520 |
| 2015 | -- | $7,120 | $2,600 | $4,520 |
| 2014 | -- | $7,120 | $2,600 | $4,520 |
| 2013 | -- | $9,040 | $2,600 | $6,440 |
Source: Public Records
Map
Nearby Homes
- 108 Smith Place
- 302 Dunmurry Place
- 102 Oregon Ct
- 405 Dunmurry Place
- 404 Dunmurry Place
- 212 Dunmurry Place
- 406 Ward St
- 202 Elmwood St
- 237 Suzanne Dr
- 427 Alabama Ave
- 423 Camellia Cir
- 423 Alabama Ave
- 423 King Dr
- 220 Wendan Way
- 145 Northsky Dr
- 139 Northsky Dr
- 125 Northsky Dr
- 505 American Blvd
- 500 Northside Dr
- 114 Williams Terrace
Your Personal Tour Guide
Ask me questions while you tour the home.