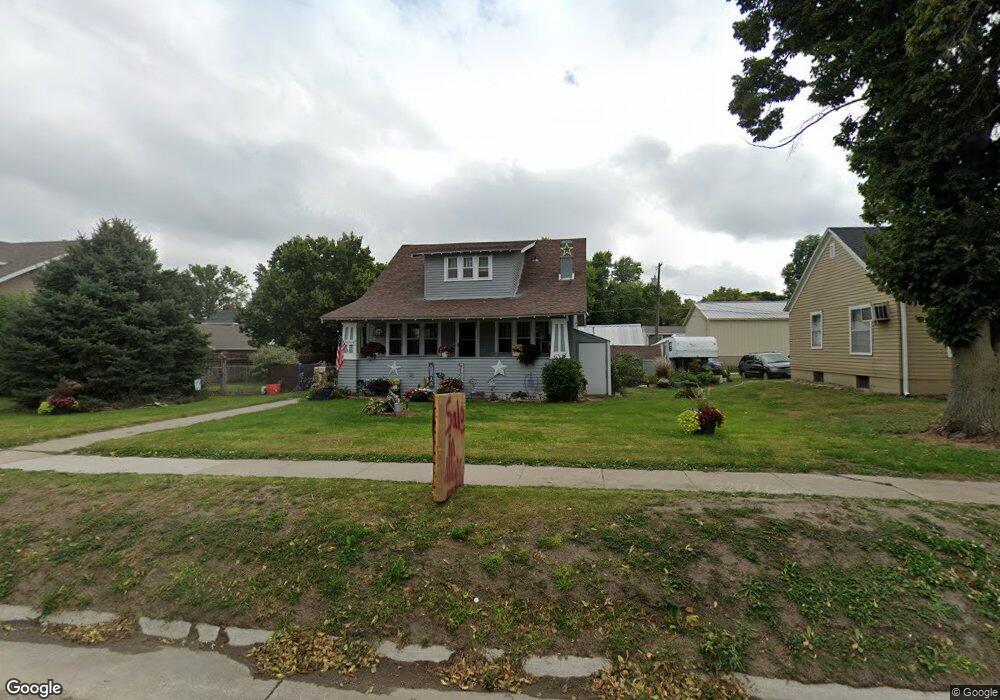
228 S E St Broken Bow, NE 68822
Estimated Value: $90,000 - $140,000
Studio
--
Bath
--
Sq Ft
--
Built
About This Home
This home is located at 228 S E St, Broken Bow, NE 68822 and is currently estimated at $105,152. 228 S E St is a home located in Custer County with nearby schools including North Park Elementary School, Broken Bow Junior High School, and Broken Bow High School.
Ownership History
Date
Name
Owned For
Owner Type
Purchase Details
Closed on
May 13, 2025
Sold by
Johnson Jacquelyn
Bought by
Powers Patrick A
Current Estimated Value
Home Financials for this Owner
Home Financials are based on the most recent Mortgage that was taken out on this home.
Original Mortgage
$47,920
Outstanding Balance
$46,958
Interest Rate
0.68%
Mortgage Type
Construction
Estimated Equity
$58,194
Purchase Details
Closed on
Aug 2, 2008
Sold by
Burnett Jackie
Bought by
Finney Jacquelyn
Purchase Details
Closed on
Apr 21, 2008
Sold by
Burnett Leota Le Etal
Bought by
Burnett Jackie
Create a Home Valuation Report for This Property
The Home Valuation Report is an in-depth analysis detailing your home's value as well as a comparison with similar homes in the area
Home Values in the Area
Average Home Value in this Area
Purchase History
| Date | Buyer | Sale Price | Title Company |
|---|---|---|---|
| Powers Patrick A | $60,000 | Russell Title & Escrow Co | |
| Finney Jacquelyn | $20,000 | -- | |
| Burnett Jackie | -- | -- |
Source: Public Records
Mortgage History
| Date | Status | Borrower | Loan Amount |
|---|---|---|---|
| Open | Powers Patrick A | $47,920 |
Source: Public Records
Tax History
| Year | Tax Paid | Tax Assessment Tax Assessment Total Assessment is a certain percentage of the fair market value that is determined by local assessors to be the total taxable value of land and additions on the property. | Land | Improvement |
|---|---|---|---|---|
| 2025 | $667 | $52,242 | $11,088 | $41,154 |
| 2024 | $729 | $59,224 | $11,088 | $48,136 |
| 2023 | $1,419 | $90,557 | $11,088 | $79,469 |
| 2022 | $1,412 | $76,955 | $11,088 | $65,867 |
| 2021 | $1,362 | $75,947 | $10,080 | $65,867 |
| 2020 | $810 | $45,552 | $10,080 | $35,472 |
| 2019 | $1,198 | $67,474 | $7,560 | $59,914 |
| 2017 | $907 | $49,654 | $7,560 | $42,094 |
| 2016 | $934 | $46,731 | $4,637 | $42,094 |
| 2015 | $900 | $44,663 | $4,543 | $40,120 |
| 2014 | $900 | $40,603 | $4,130 | $36,473 |
Source: Public Records
Map
Nearby Homes
Your Personal Tour Guide
Ask me questions while you tour the home.