228 Walnut St Abington, MA 02351
Abington AreaEstimated Value: $550,000 - $624,402
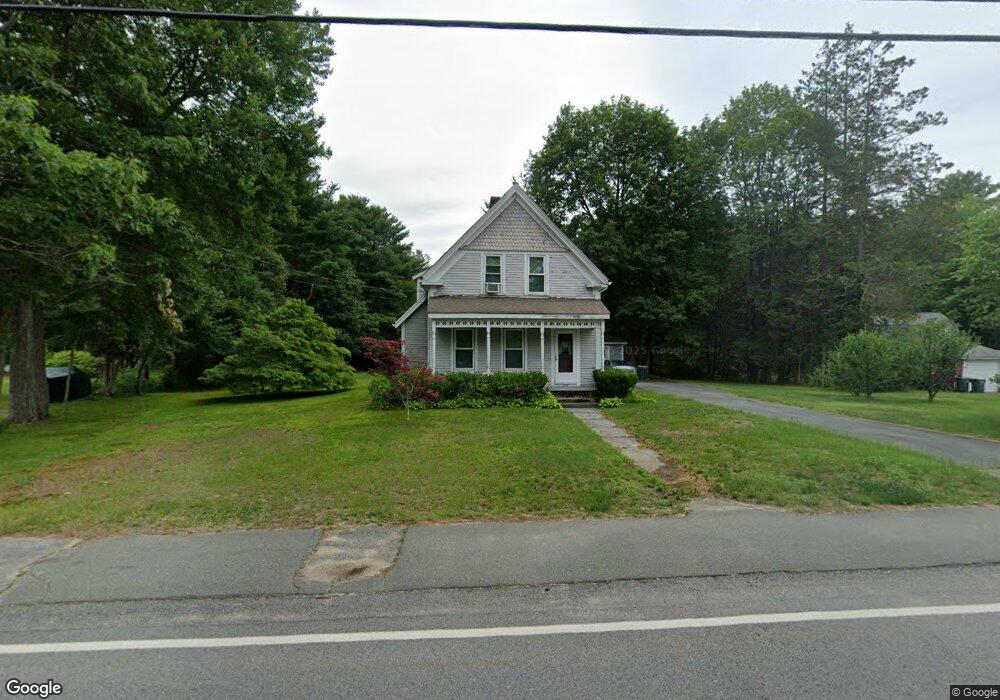
About This Home
This home is located at 228 Walnut St, Abington, MA 02351 and is currently estimated at $574,851, approximately $366 per square foot. 228 Walnut St is a home located in Plymouth County with nearby schools including Beaver Brook Elementary School, Abington Middle School, and Woodsdale School.
Ownership History
We collect this data history from publicly available records. To have your information removed, we recommend requesting removal directly through your county’s website.
Purchase Details
Purchase Details
Home Values in the Area
Average Home Value in this Area
Purchase History
We collect this data history from publicly available records. To have your information removed, we recommend requesting removal directly through your county’s website.
| Date | Buyer | Sale Price | Title Company |
|---|---|---|---|
| -- | -- | ||
| $34,000 | -- |
Mortgage History
We collect this data history from publicly available records. To have your information removed, we recommend requesting removal directly through your county’s website.
| Date | Status | Borrower | Loan Amount |
|---|---|---|---|
| Previous Owner | $65,000 |
Tax History
We collect this data history from publicly available records. To have your information removed, we recommend requesting removal directly through your county’s website.
| Year | Tax Paid | Tax Assessment Tax Assessment Total Assessment is a certain percentage of the fair market value that is determined by local assessors to be the total taxable value of land and additions on the property. | Land | Improvement |
|---|---|---|---|---|
| 2025 | $6,735 | $515,700 | $308,500 | $207,200 |
| 2024 | $6,615 | $494,400 | $284,600 | $209,800 |
| 2023 | $6,680 | $470,100 | $262,900 | $207,200 |
| 2022 | $6,351 | $417,300 | $226,600 | $190,700 |
| 2021 | $7,880 | $367,000 | $210,500 | $156,500 |
| 2020 | $6,259 | $368,200 | $211,700 | $156,500 |
| 2019 | $6,402 | $342,900 | $204,800 | $138,100 |
| 2018 | $6,343 | $332,900 | $204,800 | $128,100 |
| 2017 | $7,603 | $312,700 | $204,800 | $107,900 |
| 2016 | $5,352 | $298,500 | $190,600 | $107,900 |
| 2015 | $5,066 | $298,000 | $190,600 | $107,400 |
Map
- 34 Brockton Ave
- 15 Russell Rd
- 1121 Washington St
- 40 Washington St
- 46 Orange St
- 154 Bedford St
- 1012 Washington St
- 70 Groveland St
- 518 Summer St
- 173 Alden St
- 1907 Thayer St
- 13 Mahoney Cir
- 360 High St
- 96 Central St
- 751 Washington St
- 446 Plymouth St
- 300 High St
- 12 Lydon Ln Unit A2
- 62 Clapp St
- 55 Clapp St
Ask me questions while you tour the home.