229 Eagan St Walla Walla, WA 99362
Walla Walla AreaEstimated Value: $378,000 - $579,000
About This Home
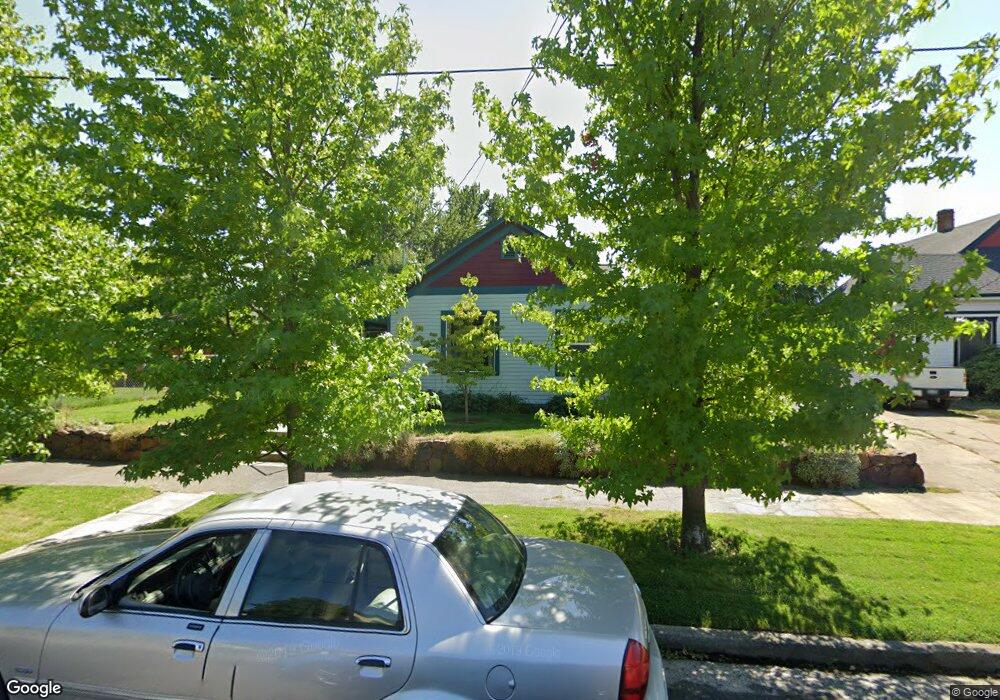
This home is located at 229 Eagan St, Walla Walla, WA 99362 and is currently estimated at $452,670, approximately $311 per square foot. 229 Eagan St is a home located in Walla Walla County with nearby schools including Sharpstein Elementary School, Garrison Middle School, and Discovery Center.
Ownership History
We collect this data history from publicly available records. To have your information removed, we recommend requesting removal directly through your county’s website.
Purchase Details
Purchase Details
Home Financials for this Owner
Home Financials are based on the most recent Mortgage that was taken out on this home.Purchase History
We collect this data history from publicly available records. To have your information removed, we recommend requesting removal directly through your county’s website.
| Date | Buyer | Sale Price | Title Company |
|---|---|---|---|
| $353,118 | Land Title Of Walla Walla Co | ||
| $183,026 | Land Title Of Walla Walla Co |
Mortgage History
We collect this data history from publicly available records. To have your information removed, we recommend requesting removal directly through your county’s website.
| Date | Status | Borrower | Loan Amount |
|---|---|---|---|
| Previous Owner | $20,340 | ||
| Previous Owner | $146,160 | ||
| Previous Owner | $125,910 |
Tax History
We collect this data history from publicly available records. To have your information removed, we recommend requesting removal directly through your county’s website.
| Year | Tax Paid | Tax Assessment Tax Assessment Total Assessment is a certain percentage of the fair market value that is determined by local assessors to be the total taxable value of land and additions on the property. | Land | Improvement |
|---|---|---|---|---|
| 2025 | $4,122 | $416,330 | $76,880 | $339,450 |
| 2024 | $3,260 | $416,330 | $76,880 | $339,450 |
| 2023 | $3,260 | $368,020 | $49,220 | $318,800 |
| 2022 | $2,970 | $352,840 | $49,220 | $303,620 |
| 2021 | $2,829 | $274,120 | $49,220 | $224,900 |
| 2020 | $2,796 | $236,640 | $49,220 | $187,420 |
| 2019 | $2,558 | $236,640 | $49,220 | $187,420 |
| 2018 | $3,112 | $236,640 | $49,220 | $187,420 |
| 2017 | $2,674 | $235,690 | $46,600 | $189,090 |
| 2016 | $2,811 | $218,500 | $46,600 | $171,900 |
| 2015 | $2,751 | $218,500 | $46,600 | $171,900 |
| 2014 | -- | $218,500 | $46,600 | $171,900 |
| 2013 | -- | $218,500 | $46,600 | $171,900 |
Map
- 220 McAuliff St
- 214 Eagan St
- 254 W Chestnut St
- 15 Eagan St
- 616 S 2nd Ave
- 311 Chase Ave
- 432 S 7th Ave
- 502 S 1st Ave
- 434 Sprague St
- 801 S 4th Ave
- 364 Catherine St Unit M09
- 123 E Maple St
- 610 W Poplar St
- 19 W Morton St
- 622 W Poplar St
- 527 Catherine St
- 720 S Palouse St
- 918 W Chestnut St
- 389 S Palouse St
- 703-713 W Main
Ask me questions while you tour the home.