
Seller's Agent in 2024
Tamra Allen
Production Realty
(517) 745-6405
8 in this area
92 Total Sales


Estimated Value: $146,000 - $160,000
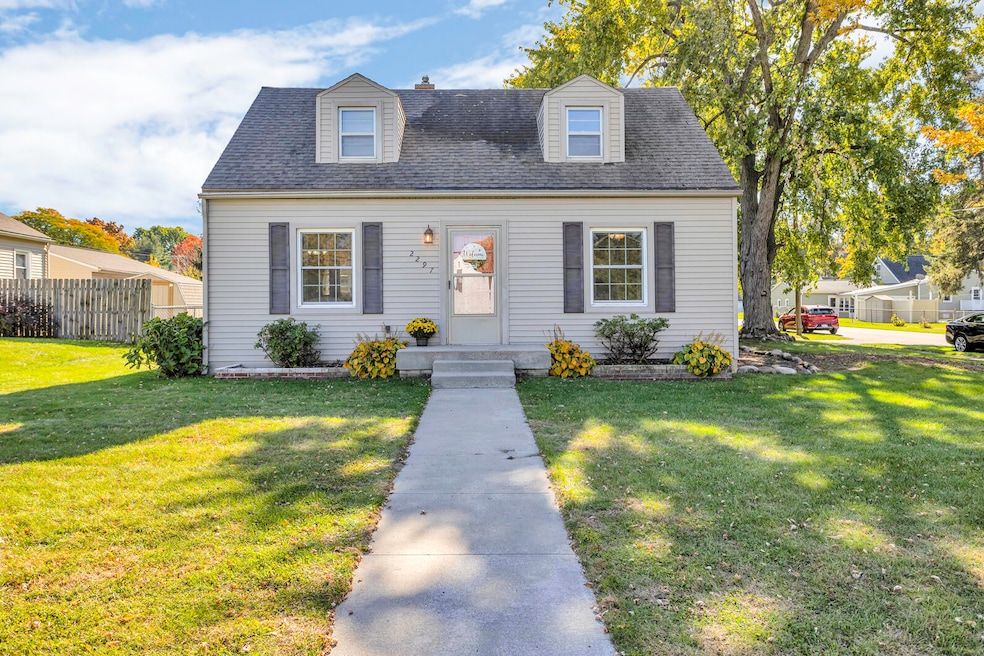
Blackman bungalow on a corner lot with soo much to offer! fenced in yard, new shed, patio and an all season screened in porch.. Clean and ready for your personal touch! appliances, washer and dryer stay!
Last Agent to Sell the Property
Production Realty License #6501394988 Listed on: 10/30/2024
| Date | Buyer | Sale Price | Title Company |
|---|---|---|---|
| Richardson Yvonne J | -- | -- | |
| Richardson Yvonne J | $92,900 | -- | |
| Truszkowski Aaron Henry | $63,000 | Midstate Title Company |
| Date | Status | Borrower | Loan Amount |
|---|---|---|---|
| Previous Owner | Richardson Yvonne J | $62,000 | |
| Previous Owner | Truszkowski Aaron Henry | $56,700 |
| Date | Event | Price | List to Sale | Price per Sq Ft |
|---|---|---|---|---|
| 12/06/2024 12/06/24 | Sold | $155,000 | -6.1% | $137 / Sq Ft |
| 10/30/2024 10/30/24 | For Sale | $165,000 | -- | $146 / Sq Ft |
| Year | Tax Paid | Tax Assessment Tax Assessment Total Assessment is a certain percentage of the fair market value that is determined by local assessors to be the total taxable value of land and additions on the property. | Land | Improvement |
|---|---|---|---|---|
| 2025 | $2,006 | $60,550 | $0 | $0 |
| 2024 | $12 | $59,100 | $0 | $0 |
| 2023 | $1,190 | $55,300 | $0 | $0 |
| 2022 | $1,824 | $55,300 | $0 | $0 |
| 2021 | $1,791 | $56,500 | $0 | $0 |
| 2020 | $1,769 | $54,000 | $0 | $0 |
| 2019 | $1,720 | $49,800 | $0 | $0 |
| 2018 | $1,568 | $49,200 | $0 | $0 |
| 2017 | $1,353 | $45,100 | $0 | $0 |
| 2016 | $883 | $44,427 | $44,427 | $0 |
| 2015 | $1,276 | $43,915 | $43,915 | $0 |
| 2014 | $1,276 | $42,253 | $42,253 | $0 |
| 2013 | -- | $42,253 | $42,253 | $0 |
Seller's Agent in 2024
Tamra Allen
Production Realty
(517) 745-6405
8 in this area
92 Total Sales
D
Buyer's Agent in 2024
Daniel Martin
ProBroker Realty, LC
(313) 550-2267
1 in this area
5 Total Sales
Source: MichRIC
MLS Number: 24057067
APN: 000-08-33-106-001-00
Disclaimer: Certain information contained herein is derived from information provided by parties other than Homes.com. All information provided is deemed reliable, but is not guaranteed to be accurate and should be independently verified.
![]() Information is deemed reliable but not guaranteed.
Information is deemed reliable but not guaranteed.
Copyright 2026 MichRIC, LLC. All rights reserved.
Ask me questions while you tour the home.