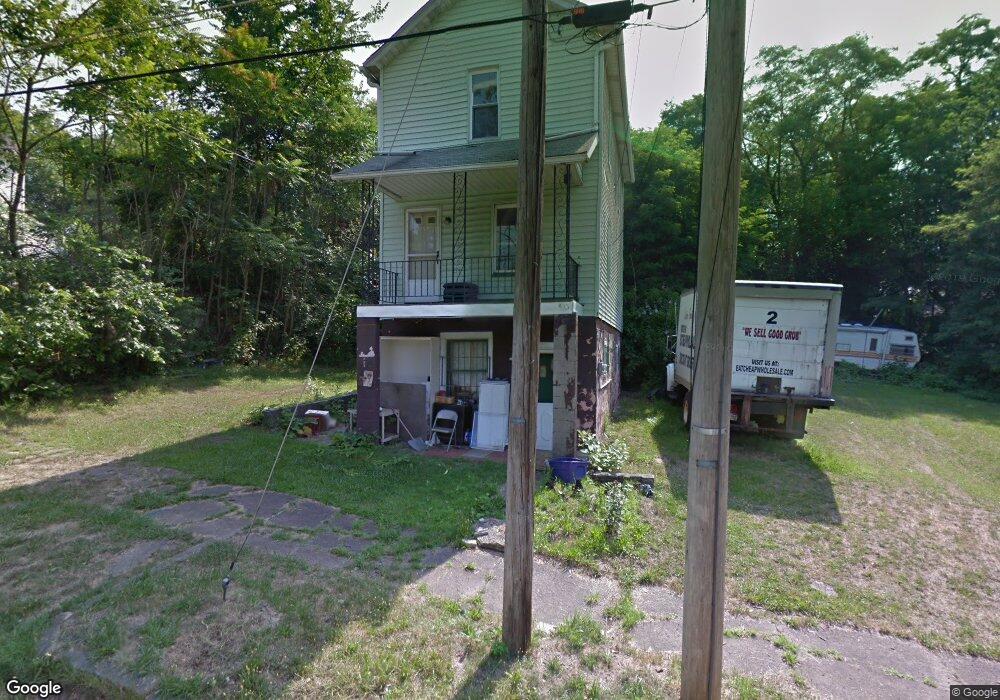
23 8th St Campbell, OH 44405
Estimated Value: $42,785 - $127,000
2
Beds
1
Bath
896
Sq Ft
$83/Sq Ft
Est. Value
About This Home
This home is located at 23 8th St, Campbell, OH 44405 and is currently estimated at $74,696, approximately $83 per square foot. 23 8th St is a home located in Mahoning County with nearby schools including Campbell Elementary School, Memorial High School, and Northeast Ohio Impact Academy.
Ownership History
Date
Name
Owned For
Owner Type
Purchase Details
Closed on
Jan 19, 2012
Sold by
Marcussen Arthur J
Bought by
Schmitz Catherine
Current Estimated Value
Purchase Details
Closed on
Sep 22, 2009
Sold by
Optimum Realty Corporation
Bought by
Marcussen Authur J
Purchase Details
Closed on
Jan 26, 2009
Sold by
Lyle Pamela J
Bought by
Optimum Realty Corporation
Purchase Details
Closed on
Aug 18, 2005
Sold by
Johnson Rufus
Bought by
Lyle Pamela J
Purchase Details
Closed on
Aug 30, 1993
Bought by
Johnson Mary L
Create a Home Valuation Report for This Property
The Home Valuation Report is an in-depth analysis detailing your home's value as well as a comparison with similar homes in the area
Home Values in the Area
Average Home Value in this Area
Purchase History
| Date | Buyer | Sale Price | Title Company |
|---|---|---|---|
| Schmitz Catherine | $1,200 | None Available | |
| Marcussen Authur J | $1,000 | None Available | |
| Optimum Realty Corporation | -- | Attorney | |
| Lyle Pamela J | -- | None Available | |
| Johnson Mary L | $4,500 | -- |
Source: Public Records
Tax History
| Year | Tax Paid | Tax Assessment Tax Assessment Total Assessment is a certain percentage of the fair market value that is determined by local assessors to be the total taxable value of land and additions on the property. | Land | Improvement |
|---|---|---|---|---|
| 2025 | $218 | $4,020 | $170 | $3,850 |
| 2024 | $218 | $4,020 | $170 | $3,850 |
| 2023 | $216 | $4,020 | $170 | $3,850 |
| 2022 | $165 | $2,440 | $170 | $2,270 |
| 2021 | $148 | $2,440 | $170 | $2,270 |
| 2020 | $150 | $2,440 | $170 | $2,270 |
| 2019 | $146 | $2,080 | $170 | $1,910 |
| 2018 | $157 | $2,080 | $170 | $1,910 |
| 2017 | $152 | $2,080 | $170 | $1,910 |
| 2016 | $157 | $2,360 | $170 | $2,190 |
| 2015 | $154 | $2,360 | $170 | $2,190 |
| 2014 | $153 | $2,360 | $170 | $2,190 |
| 2013 | $150 | $2,360 | $170 | $2,190 |
Source: Public Records
Map
Nearby Homes
- 130 12th St
- 190 10th St
- 374 Tenney Ave
- 114 Penhale Ave
- 459 Tenney Ave
- 412 Whipple Ave
- 0 Penhale Ave
- 330 Sanderson Ave
- 321 Porter Ave
- 204 Tremble Ave
- 127 Blackburn St
- 664 Tenney Ave
- 3516 Champlain Ave
- 252 State St
- 3563 Valerie Dr
- 279 Coitsville Rd
- 151 Regent St
- 121 Princess St
- 377 Coitsville Rd
- 159 Piccadilly St
Your Personal Tour Guide
Ask me questions while you tour the home.