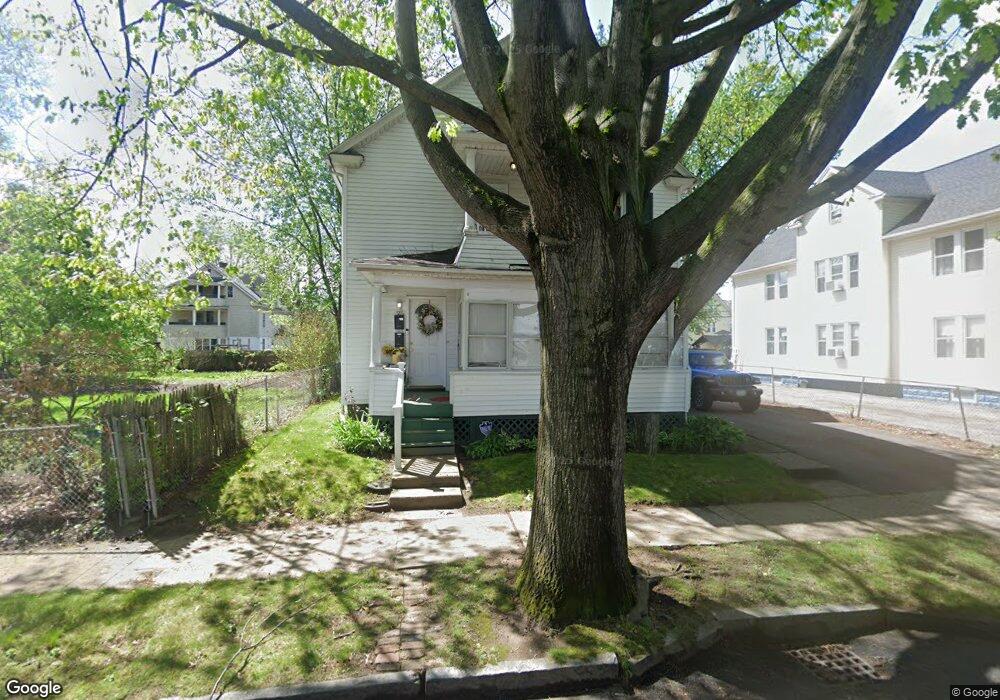
23 Abbe Ave Unit 25 Springfield, MA 01107
Brightwood NeighborhoodEstimated Value: $260,000 - $347,000
6
Beds
2
Baths
2,566
Sq Ft
$123/Sq Ft
Est. Value
About This Home
This home is located at 23 Abbe Ave Unit 25, Springfield, MA 01107 and is currently estimated at $315,179, approximately $122 per square foot. 23 Abbe Ave Unit 25 is a home located in Hampden County with nearby schools including High School Of Commerce, Springfield High School of Science and Technology, and Roger L. Putnam Vocational Technical Academy.
Ownership History
Date
Name
Owned For
Owner Type
Purchase Details
Closed on
May 5, 2000
Sold by
Lemay Katherine H and Mitchell Patricia N
Bought by
Mitchell Penny
Current Estimated Value
Home Financials for this Owner
Home Financials are based on the most recent Mortgage that was taken out on this home.
Original Mortgage
$74,450
Outstanding Balance
$25,850
Interest Rate
8.21%
Mortgage Type
Purchase Money Mortgage
Estimated Equity
$289,329
Create a Home Valuation Report for This Property
The Home Valuation Report is an in-depth analysis detailing your home's value as well as a comparison with similar homes in the area
Home Values in the Area
Average Home Value in this Area
Purchase History
| Date | Buyer | Sale Price | Title Company |
|---|---|---|---|
| Mitchell Penny | $74,900 | -- |
Source: Public Records
Mortgage History
| Date | Status | Borrower | Loan Amount |
|---|---|---|---|
| Open | Mitchell Penny | $74,450 | |
| Previous Owner | Mitchell Penny | $14,000 | |
| Previous Owner | Mitchell Penny | $7,000 | |
| Closed | Mitchell Penny | $5,000 |
Source: Public Records
Tax History
| Year | Tax Paid | Tax Assessment Tax Assessment Total Assessment is a certain percentage of the fair market value that is determined by local assessors to be the total taxable value of land and additions on the property. | Land | Improvement |
|---|---|---|---|---|
| 2025 | $4,495 | $286,700 | $30,600 | $256,100 |
| 2024 | $3,976 | $247,600 | $30,600 | $217,000 |
| 2023 | $3,541 | $207,700 | $27,800 | $179,900 |
| 2022 | $3,442 | $182,900 | $26,000 | $156,900 |
| 2021 | $3,264 | $172,700 | $23,600 | $149,100 |
| 2020 | $3,076 | $157,500 | $23,600 | $133,900 |
| 2019 | $2,702 | $137,300 | $23,600 | $113,700 |
| 2018 | $2,590 | $131,600 | $23,600 | $108,000 |
| 2017 | $2,454 | $124,800 | $17,700 | $107,100 |
| 2016 | $2,031 | $103,300 | $17,700 | $85,600 |
| 2015 | $1,953 | $99,300 | $17,700 | $81,600 |
Source: Public Records
Map
Nearby Homes
Your Personal Tour Guide
Ask me questions while you tour the home.