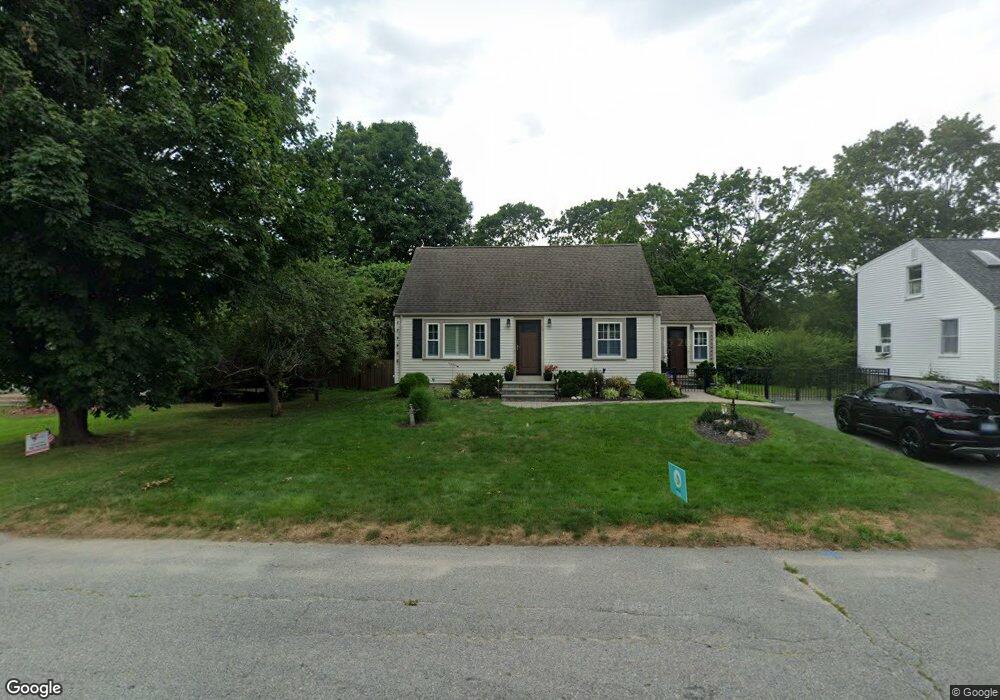
23 Bugbee Ave Warwick, RI 02889
Long Meadow NeighborhoodEstimated Value: $397,648 - $452,000
About This Home
This home is located at 23 Bugbee Ave, Warwick, RI 02889 and is currently estimated at $423,912, approximately $273 per square foot. 23 Bugbee Ave is a home located in Kent County with nearby schools including Saint Kevin School and Bishop Hendricken High School.
Ownership History
We collect this data history from publicly available records. To have your information removed, we recommend requesting removal directly through your county’s website.
Purchase Details
Home Financials for this Owner
Home Financials are based on the most recent Mortgage that was taken out on this home.Home Values in the Area
Average Home Value in this Area
Purchase History
We collect this data history from publicly available records. To have your information removed, we recommend requesting removal directly through your county’s website.
| Date | Buyer | Sale Price | Title Company |
|---|---|---|---|
| $88,000 | -- |
Mortgage History
We collect this data history from publicly available records. To have your information removed, we recommend requesting removal directly through your county’s website.
| Date | Status | Borrower | Loan Amount |
|---|---|---|---|
| Open | $15,000 | ||
| Open | $87,400 |
Tax History
We collect this data history from publicly available records. To have your information removed, we recommend requesting removal directly through your county’s website.
| Year | Tax Paid | Tax Assessment Tax Assessment Total Assessment is a certain percentage of the fair market value that is determined by local assessors to be the total taxable value of land and additions on the property. | Land | Improvement |
|---|---|---|---|---|
| 2025 | $4,591 | $361,500 | $107,400 | $254,100 |
| 2024 | $4,350 | $300,600 | $93,300 | $207,300 |
| 2023 | $4,266 | $300,600 | $93,300 | $207,300 |
| 2022 | $3,941 | $210,400 | $54,200 | $156,200 |
| 2021 | $3,941 | $210,400 | $54,200 | $156,200 |
| 2020 | $3,941 | $210,400 | $54,200 | $156,200 |
| 2019 | $3,941 | $210,400 | $54,200 | $156,200 |
| 2018 | $3,505 | $168,500 | $54,200 | $114,300 |
| 2017 | $3,410 | $168,500 | $54,200 | $114,300 |
| 2016 | $3,410 | $168,500 | $54,200 | $114,300 |
| 2015 | $3,202 | $154,300 | $56,400 | $97,900 |
| 2014 | $3,095 | $154,300 | $56,400 | $97,900 |
| 2013 | $3,054 | $154,300 | $56,400 | $97,900 |
Map
- 80 Killey Ave
- 20 Killey Ave
- 222 Killey Ave Unit 12
- 52 Merle St
- 32 Stillwater Dr
- 121 Fern St
- 325 Church Ave
- 88 Glenbrook Rd
- 43 New Britain Dr
- 139 Overbrook Ave
- 27 Amherst Rd
- 185 Vineyard Rd
- 157 Betsey Williams Dr
- 142 Yucatan Dr
- 591 Sandy Ln
- 45 Haven St
- 301 W Shore Rd Unit 19
- 97 Delwood Rd
- 145 Crane St
- 243 Warner Brook Dr
Ask me questions while you tour the home.