
Landlord's Agent in 2025
Kevin Bilafer
Berkshire Hathaway HomeServices Commonwealth Real Estate
(978) 201-4248
5 in this area
12 Total Sales


Estimated Value: $481,000 - $526,000
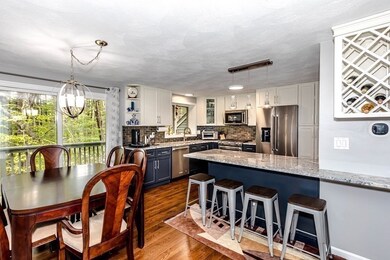
4 level townhome, over 2100sq/ft, Hardwood Floors. 2 Bedrooms with optional Bonus Room for third. Updated kitchen, stainless steel appliances. Updated Baths. Private views off back deck. Finished 3rd floor with skylight, fireplace and closet could be used as an office or 3rd bedroom. Finished walk-out lower level adds additional living space. Deer Path amenities include Fitness Room, Pool, Tennis courts, Pickleball and Clubhouse. Close to downtown Maynard & West Concord, shops at Maynard Crossing and all shopping. 2 assigned parking spaces.
Last Agent to Rent the Property
Berkshire Hathaway HomeServices Commonwealth Real Estate Listed on: 09/15/2024
Last Renter's Agent
Berkshire Hathaway HomeServices Commonwealth Real Estate Listed on: 09/15/2024
| Date | Buyer | Sale Price | Title Company |
|---|---|---|---|
| Lipson Brian | $410,000 | None Available | |
| Cannon Alla | $296,500 | -- | |
| Carp Courtney H | $267,500 | -- | |
| Wells Fargo Bk | -- | -- | |
| Mwaura Jane | $282,000 | -- | |
| Scannell Kenneth | $139,900 | -- |
| Date | Status | Borrower | Loan Amount |
|---|---|---|---|
| Open | Lipson Brian | $300,000 | |
| Previous Owner | Scannell Kenneth | $229,500 | |
| Previous Owner | Carp Courtney H | $240,750 | |
| Previous Owner | Mwaura Jane | $225,600 | |
| Previous Owner | Scannell Kenneth | $80,000 |
| Date | Event | Price | List to Sale | Price per Sq Ft | Prior Sale |
|---|---|---|---|---|---|
| 01/24/2025 01/24/25 | Rented | $3,400 | 0.0% | -- | |
| 11/18/2024 11/18/24 | Under Contract | -- | -- | -- | |
| 10/16/2024 10/16/24 | Price Changed | $3,400 | -1.4% | $2 / Sq Ft | |
| 10/05/2024 10/05/24 | Price Changed | $3,450 | -1.4% | $2 / Sq Ft | |
| 09/15/2024 09/15/24 | For Rent | $3,500 | 0.0% | -- | |
| 06/15/2021 06/15/21 | Sold | $410,000 | +5.1% | $190 / Sq Ft | View Prior Sale |
| 05/17/2021 05/17/21 | Pending | -- | -- | -- | |
| 05/11/2021 05/11/21 | For Sale | $390,000 | +31.5% | $180 / Sq Ft | |
| 06/14/2019 06/14/19 | Sold | $296,500 | -0.5% | $137 / Sq Ft | View Prior Sale |
| 05/06/2019 05/06/19 | Pending | -- | -- | -- | |
| 05/06/2019 05/06/19 | For Sale | $298,000 | 0.0% | $138 / Sq Ft | |
| 05/02/2019 05/02/19 | For Sale | $298,000 | -- | $138 / Sq Ft |
| Year | Tax Paid | Tax Assessment Tax Assessment Total Assessment is a certain percentage of the fair market value that is determined by local assessors to be the total taxable value of land and additions on the property. | Land | Improvement |
|---|---|---|---|---|
| 2025 | $7,851 | $440,300 | $0 | $440,300 |
| 2024 | $7,345 | $410,800 | $0 | $410,800 |
| 2023 | $7,133 | $376,000 | $0 | $376,000 |
| 2022 | $6,729 | $327,900 | $0 | $327,900 |
| 2021 | $6,134 | $304,400 | $0 | $304,400 |
| 2020 | $6,308 | $305,600 | $0 | $305,600 |
| 2019 | $5,786 | $275,000 | $0 | $275,000 |
| 2018 | $5,655 | $249,800 | $0 | $249,800 |
| 2017 | $5,296 | $240,600 | $0 | $240,600 |
| 2016 | $5,113 | $240,600 | $0 | $240,600 |
| 2015 | $4,703 | $210,800 | $0 | $210,800 |
| 2014 | $4,329 | $194,200 | $0 | $194,200 |
Landlord's Agent in 2025
Kevin Bilafer
Berkshire Hathaway HomeServices Commonwealth Real Estate
(978) 201-4248
5 in this area
12 Total Sales
Seller's Agent in 2021
Cheryl Chi
William Raveis R.E. & Home Services
(978) 835-2822
3 in this area
70 Total Sales
M
Seller's Agent in 2019
Marilyn Messenger
Realty Executives Boston West
Source: MLS Property Information Network (MLS PIN)
MLS Number: 73290278
APN: MAYN-000016-000000-000023-000003
Disclaimer: Certain information contained herein is derived from information provided by parties other than Homes.com. All information provided is deemed reliable, but is not guaranteed to be accurate and should be independently verified.
![]() The property listing data and information, or the Images, set forth herein were provided to MLS Property Information Network, Inc. from third party sources, including sellers, lessors and public records, and were compiled by MLS Property Information Network, Inc. The property listing data and information, and the Images, are for the personal, non-commercial use of consumers having a good faith interest in purchasing or leasing listed properties of the type displayed to them and may not be used for any purpose other than to identify prospective properties which such consumers may have a good faith interest in purchasing or leasing. MLS Property Information Network, Inc. and its subscribers disclaim any and all representations and warranties as to the accuracy of the property listing data and information, or as to the accuracy of any of the Images, set forth herein.
The property listing data and information, or the Images, set forth herein were provided to MLS Property Information Network, Inc. from third party sources, including sellers, lessors and public records, and were compiled by MLS Property Information Network, Inc. The property listing data and information, and the Images, are for the personal, non-commercial use of consumers having a good faith interest in purchasing or leasing listed properties of the type displayed to them and may not be used for any purpose other than to identify prospective properties which such consumers may have a good faith interest in purchasing or leasing. MLS Property Information Network, Inc. and its subscribers disclaim any and all representations and warranties as to the accuracy of the property listing data and information, or as to the accuracy of any of the Images, set forth herein.
Ask me questions while you tour the home.