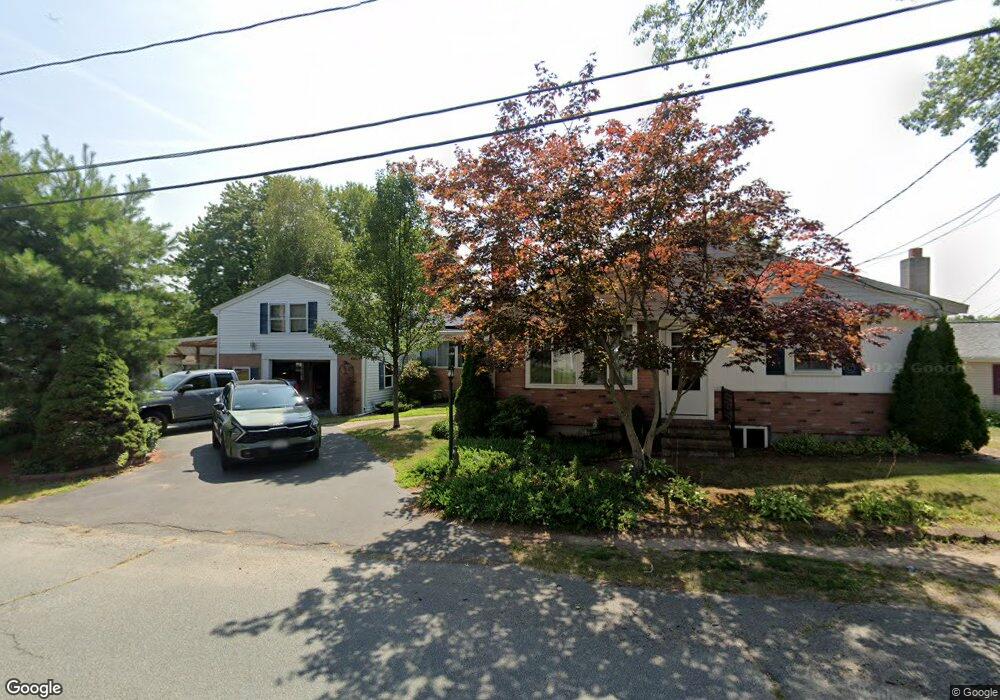
23 E Shore Rd Holbrook, MA 02343
Estimated Value: $525,000 - $558,000
3
Beds
2
Baths
1,519
Sq Ft
$359/Sq Ft
Est. Value
About This Home
This home is located at 23 E Shore Rd, Holbrook, MA 02343 and is currently estimated at $545,897, approximately $359 per square foot. 23 E Shore Rd is a home located in Norfolk County with nearby schools including John F. Kennedy Elementary School, Holbrook Middle High School, and Boston Higashi School.
Ownership History
Date
Name
Owned For
Owner Type
Purchase Details
Closed on
May 25, 2021
Sold by
Schneider Ruth E and Doty David
Bought by
Doty David
Current Estimated Value
Purchase Details
Closed on
Sep 13, 2006
Sold by
Doty Ruth E and Schneider Ruth E
Bought by
Doty David and Schneider Ruth E
Create a Home Valuation Report for This Property
The Home Valuation Report is an in-depth analysis detailing your home's value as well as a comparison with similar homes in the area
Home Values in the Area
Average Home Value in this Area
Purchase History
We collect this data history from publicly available records. To have your information removed, we recommend requesting removal directly through your county’s website.
| Date | Buyer | Sale Price | Title Company |
|---|---|---|---|
| Doty David | -- | None Available | |
| Doty David | -- | None Available | |
| Doty David | -- | None Available | |
| Doty David | -- | -- | |
| Doty David | -- | -- | |
| Doty David | -- | -- |
Source: Public Records
Mortgage History
We collect this data history from publicly available records. To have your information removed, we recommend requesting removal directly through your county’s website.
| Date | Status | Borrower | Loan Amount |
|---|---|---|---|
| Previous Owner | Doty David | $50,000 |
Source: Public Records
Tax History
| Year | Tax Paid | Tax Assessment Tax Assessment Total Assessment is a certain percentage of the fair market value that is determined by local assessors to be the total taxable value of land and additions on the property. | Land | Improvement |
|---|---|---|---|---|
| 2025 | $67 | $505,800 | $228,600 | $277,200 |
| 2024 | $6,664 | $495,800 | $230,800 | $265,000 |
| 2023 | $7,043 | $457,900 | $206,800 | $251,100 |
| 2022 | $6,685 | $405,400 | $188,100 | $217,300 |
| 2021 | $6,497 | $377,300 | $170,700 | $206,600 |
| 2020 | $6,707 | $365,100 | $167,700 | $197,400 |
| 2019 | $6,904 | $354,800 | $167,700 | $187,100 |
| 2018 | $6,662 | $322,300 | $141,400 | $180,900 |
| 2017 | $6,335 | $303,100 | $128,300 | $174,800 |
| 2016 | $5,892 | $300,000 | $128,300 | $171,700 |
| 2015 | $5,539 | $290,300 | $126,300 | $164,000 |
| 2014 | $5,304 | $282,600 | $126,300 | $156,300 |
Source: Public Records
Map
Nearby Homes
- 4 Ell Rd
- 595 South St
- 15 Jefferson Rd
- 27 Morgan Rd
- 499 South St
- 35 Hillsdale Rd
- 38 Druid Hill Ave E
- 181 S Franklin St Unit 102
- 30 Roseen Rd
- 25 Lakeview Ave
- 7 Platts St
- 66 Frederickson Dr
- 39 Marion St
- 43 Plymouth St
- 38 Marion St
- 5 Clarendon Cir Unit Lot 4
- 10 N Glenway Ave
- 627 S Franklin St
- 148 N Franklin St
- 14 Leonard Ln
Your Personal Tour Guide
Ask me questions while you tour the home.