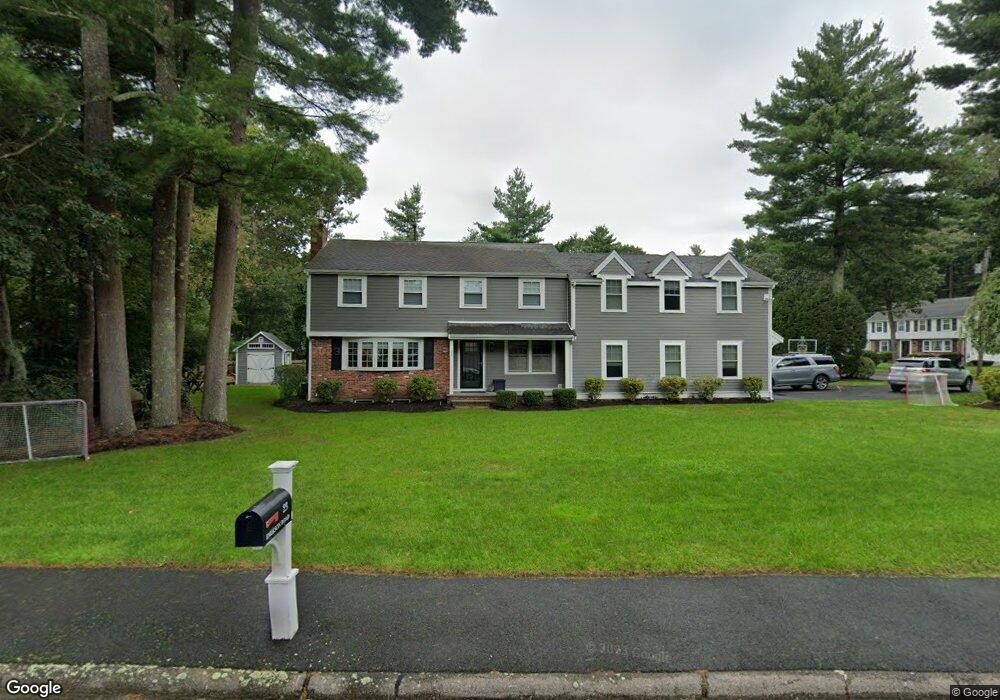
23 Emerson Rd Medfield, MA 02052
Medfield AreaEstimated Value: $1,165,000 - $1,558,948
4
Beds
3
Baths
2,278
Sq Ft
$596/Sq Ft
Est. Value
About This Home
This home is located at 23 Emerson Rd, Medfield, MA 02052 and is currently estimated at $1,358,487, approximately $596 per square foot. 23 Emerson Rd is a home located in Norfolk County with nearby schools including Memorial School, Ralph Wheelock School, and Dale Street School.
Create a Home Valuation Report for This Property
The Home Valuation Report is an in-depth analysis detailing your home's value as well as a comparison with similar homes in the area
Home Values in the Area
Average Home Value in this Area
Tax History
We collect this data history from publicly available records. To have your information removed, we recommend requesting removal directly through your county’s website.
| Year | Tax Paid | Tax Assessment Tax Assessment Total Assessment is a certain percentage of the fair market value that is determined by local assessors to be the total taxable value of land and additions on the property. | Land | Improvement |
|---|---|---|---|---|
| 2025 | $15,426 | $1,117,800 | $468,900 | $648,900 |
| 2024 | $14,704 | $1,004,400 | $420,500 | $583,900 |
| 2023 | $14,432 | $935,300 | $403,000 | $532,300 |
| 2022 | $14,061 | $807,200 | $385,500 | $421,700 |
| 2021 | $13,863 | $780,600 | $382,000 | $398,600 |
| 2020 | $13,535 | $759,100 | $373,200 | $385,900 |
| 2019 | $12,740 | $712,900 | $362,700 | $350,200 |
| 2018 | $11,626 | $682,700 | $350,400 | $332,300 |
| 2017 | $8,938 | $529,200 | $346,900 | $182,300 |
| 2016 | $8,931 | $533,200 | $325,900 | $207,300 |
| 2015 | $8,726 | $544,000 | $336,900 | $207,100 |
| 2014 | $8,136 | $504,700 | $297,600 | $207,100 |
Source: Public Records
Map
Nearby Homes
- 17 Maplewood Rd
- 3 Shining Valley Cir
- 23 Winter St
- 20 Winter St
- 431 Main St Unit 3
- 6 Hearthstone Dr
- 35 Marlyn Rd
- 60 Harding St Unit C
- 22 South St
- 4 Lincoln Ct
- 10 Donnelly Dr
- 10 Wildwood Dr
- 38 Miller St
- 5 Hickory Dr
- 11 Fox Run Rd
- 24 Oak St
- 5 Hamlins Crossing
- 25 Donnelly Dr
- 9 Bridge St
- 29 Maple Ln Unit 29
Your Personal Tour Guide
Ask me questions while you tour the home.