23 Laurel Ave Methuen, MA 01844
Downtown Methuen NeighborhoodEstimated Value: $498,000 - $518,601
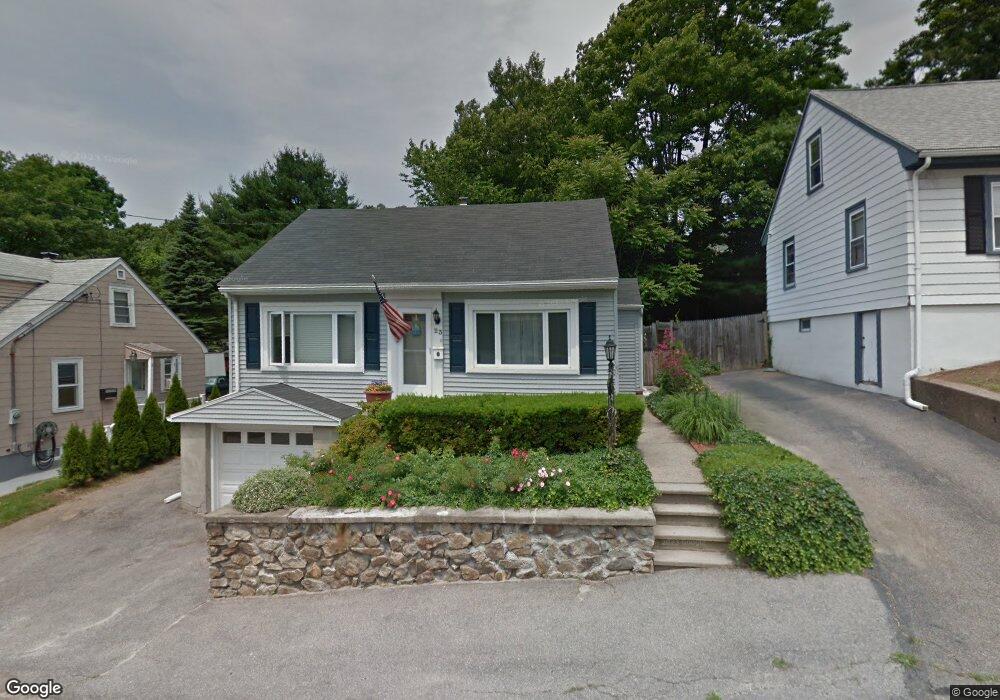
About This Home
This home is located at 23 Laurel Ave, Methuen, MA 01844 and is currently estimated at $506,150, approximately $378 per square foot. 23 Laurel Ave is a home located in Essex County with nearby schools including Tenney Grammar School, Methuen High School, and Lawrence Family Development Charter School.
Ownership History
We collect this data history from publicly available records. To have your information removed, we recommend requesting removal directly through your county’s website.
Purchase Details
Home Financials for this Owner
Home Financials are based on the most recent Mortgage that was taken out on this home.Home Values in the Area
Average Home Value in this Area
Purchase History
We collect this data history from publicly available records. To have your information removed, we recommend requesting removal directly through your county’s website.
| Date | Buyer | Sale Price | Title Company |
|---|---|---|---|
| $249,000 | -- | ||
| $249,000 | -- |
Mortgage History
We collect this data history from publicly available records. To have your information removed, we recommend requesting removal directly through your county’s website.
| Date | Status | Borrower | Loan Amount |
|---|---|---|---|
| Open | $207,050 | ||
| Closed | $199,200 | ||
| Previous Owner | $161,500 | ||
| Previous Owner | $51,500 |
Tax History
We collect this data history from publicly available records. To have your information removed, we recommend requesting removal directly through your county’s website.
| Year | Tax Paid | Tax Assessment Tax Assessment Total Assessment is a certain percentage of the fair market value that is determined by local assessors to be the total taxable value of land and additions on the property. | Land | Improvement |
|---|---|---|---|---|
| 2025 | $4,652 | $439,700 | $192,400 | $247,300 |
| 2024 | $4,594 | $423,000 | $175,500 | $247,500 |
| 2023 | $4,282 | $366,000 | $156,000 | $210,000 |
| 2022 | $3,955 | $303,100 | $123,500 | $179,600 |
| 2021 | $3,753 | $284,500 | $117,000 | $167,500 |
| 2020 | $3,758 | $279,600 | $117,000 | $162,600 |
| 2019 | $3,658 | $257,800 | $110,500 | $147,300 |
| 2018 | $3,482 | $244,000 | $104,000 | $140,000 |
| 2017 | $3,361 | $229,400 | $104,000 | $125,400 |
| 2016 | $3,026 | $204,300 | $91,000 | $113,300 |
| 2015 | $2,894 | $198,200 | $91,000 | $107,200 |
Map
- 82-84 Haverhill St
- 945 Riverside Dr Unit 29D
- 8 Glen Forest Ln
- 13 Caswell Ave
- 21 Moison Ave
- 3 Elm St
- 1 Rambler Rd
- 26 Hobson St
- 117 Pearl St
- 19 Hideaway Ln
- 0 Hudson Ave
- 15 Crescent St Unit D
- 4 Capitol St
- 9 Giles St
- 700 Brookside Dr Unit J
- 267-269 Water St
- 263-265 Water St
- 111 Woodburn Dr
- 18 Hancock St
- 41 Railroad St
Ask me questions while you tour the home.