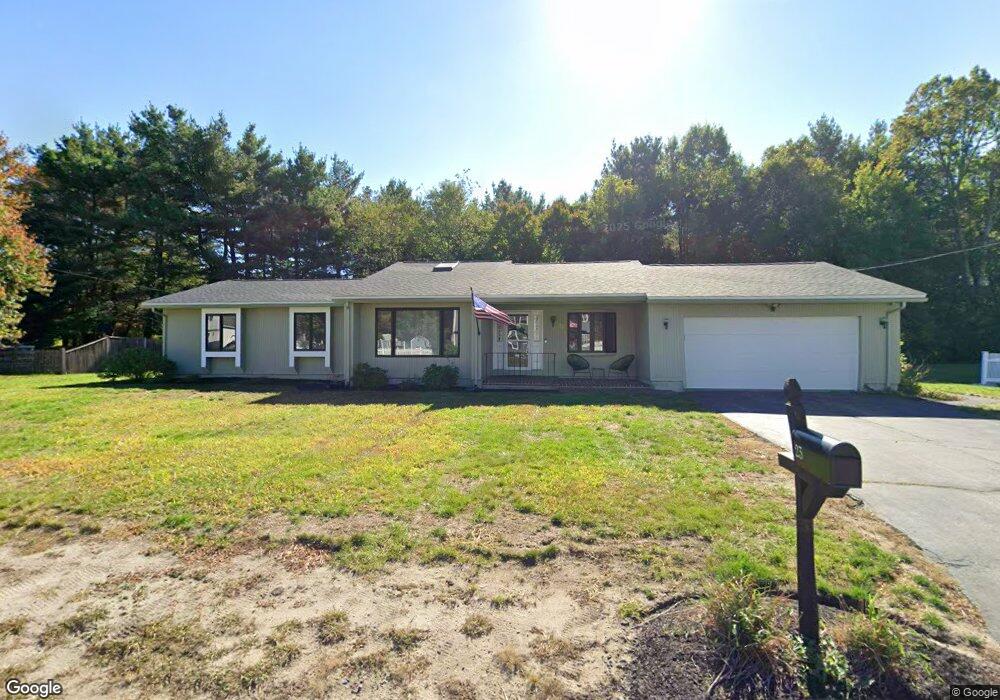
23 Lee St Lancaster, MA 01523
Estimated Value: $601,662 - $673,000
3
Beds
2
Baths
1,735
Sq Ft
$367/Sq Ft
Est. Value
About This Home
This home is located at 23 Lee St, Lancaster, MA 01523 and is currently estimated at $637,416, approximately $367 per square foot. 23 Lee St is a home located in Worcester County with nearby schools including Mary Rowlandson Elementary School, Luther Burbank Middle School, and Nashoba Regional High School.
Ownership History
Date
Name
Owned For
Owner Type
Purchase Details
Closed on
Mar 16, 2018
Sold by
James Eunice T Est and Fuller
Bought by
Stepien Daniel
Current Estimated Value
Home Financials for this Owner
Home Financials are based on the most recent Mortgage that was taken out on this home.
Original Mortgage
$349,200
Outstanding Balance
$294,078
Interest Rate
4.22%
Mortgage Type
New Conventional
Estimated Equity
$343,338
Purchase Details
Closed on
Nov 26, 1986
Bought by
James Frederick B and James Eunice T
Create a Home Valuation Report for This Property
The Home Valuation Report is an in-depth analysis detailing your home's value as well as a comparison with similar homes in the area
Home Values in the Area
Average Home Value in this Area
Purchase History
| Date | Buyer | Sale Price | Title Company |
|---|---|---|---|
| Stepien Daniel | $360,000 | -- | |
| James Frederick B | $185,000 | -- |
Source: Public Records
Mortgage History
| Date | Status | Borrower | Loan Amount |
|---|---|---|---|
| Open | Stepien Daniel | $349,200 |
Source: Public Records
Tax History
| Year | Tax Paid | Tax Assessment Tax Assessment Total Assessment is a certain percentage of the fair market value that is determined by local assessors to be the total taxable value of land and additions on the property. | Land | Improvement |
|---|---|---|---|---|
| 2025 | $8,982 | $555,800 | $104,700 | $451,100 |
| 2024 | $8,943 | $512,200 | $97,400 | $414,800 |
| 2023 | $8,231 | $478,800 | $88,600 | $390,200 |
| 2022 | $7,556 | $388,500 | $91,900 | $296,600 |
| 2021 | $7,321 | $366,400 | $91,900 | $274,500 |
| 2020 | $7,477 | $376,700 | $91,900 | $284,800 |
| 2019 | $6,822 | $345,400 | $91,900 | $253,500 |
| 2018 | $6,182 | $309,400 | $91,900 | $217,500 |
| 2016 | $5,658 | $289,400 | $91,100 | $198,300 |
| 2015 | $5,377 | $286,600 | $91,100 | $195,500 |
| 2014 | $5,246 | $277,400 | $91,100 | $186,300 |
Source: Public Records
Map
Nearby Homes
- 600 Red Tail Way
- 132 Kilbourn Rd
- 110 Ridgefield Cir Unit C
- 303 Ridgefield Cir Unit A
- 7-9 Boynton St
- 201 Stone St Unit 203
- 0 Parker Rd
- 201-203 Stone St
- 508 High St
- 861 Main St
- 42 Elm St
- 111 Goss Ln
- 57 Clark St
- 719 Main St
- 55 Sterling St Unit 306
- 55 Sterling St Unit 314
- 55 Sterling St Unit 212
- 55 Sterling St Unit 305
- 11 Cromie St
- 229 Sterling St
Your Personal Tour Guide
Ask me questions while you tour the home.