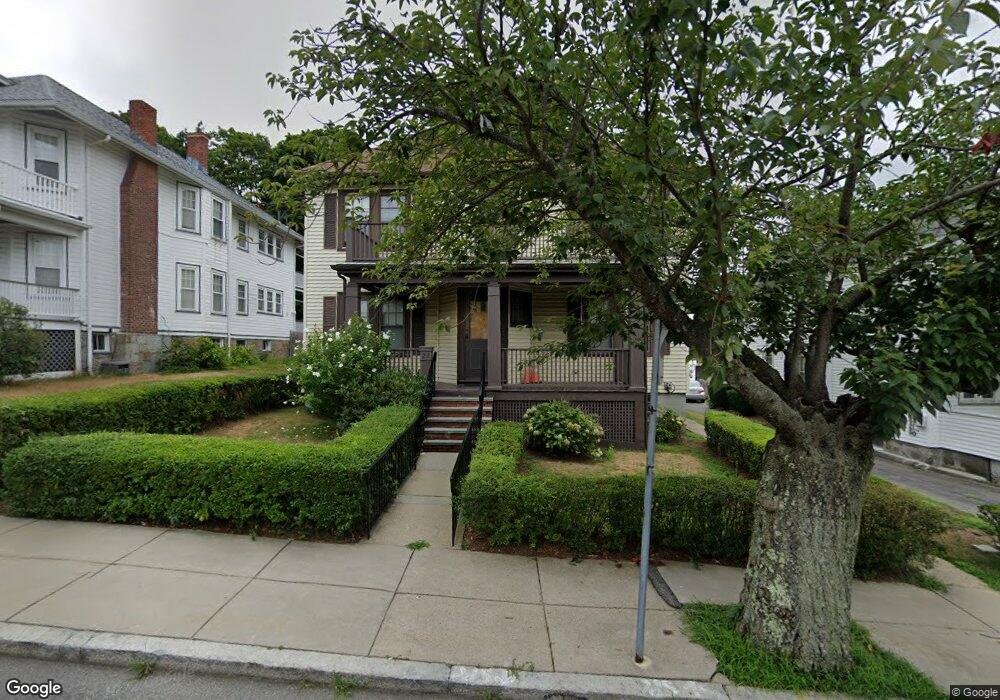
23 Matchett St Brighton, MA 02135
Brighton NeighborhoodEstimated Value: $1,107,000 - $1,258,000
6
Beds
2
Baths
2,764
Sq Ft
$420/Sq Ft
Est. Value
About This Home
This home is located at 23 Matchett St, Brighton, MA 02135 and is currently estimated at $1,161,478, approximately $420 per square foot. 23 Matchett St is a home located in Suffolk County with nearby schools including St Columbkille Partnership School, Shaloh House Jewish Day School, and Mesivta High School of Greater Boston.
Ownership History
Date
Name
Owned For
Owner Type
Purchase Details
Closed on
Jul 15, 2023
Sold by
Mcclellan Eileen J Est and Mcclellan
Bought by
Eileen J Mcclellan Ret and Mcclellan
Current Estimated Value
Purchase Details
Closed on
Jan 7, 2021
Sold by
Benson Mary A Est and Mcclellan
Bought by
Mcclellan Ellen J and Mcclellan Christopher
Create a Home Valuation Report for This Property
The Home Valuation Report is an in-depth analysis detailing your home's value as well as a comparison with similar homes in the area
Home Values in the Area
Average Home Value in this Area
Purchase History
| Date | Buyer | Sale Price | Title Company |
|---|---|---|---|
| Eileen J Mcclellan Ret | -- | None Available | |
| Eileen J Mcclellan Ret | -- | None Available | |
| Mcclellan Ellen J | -- | None Available | |
| Mcclellan Ellen J | -- | None Available |
Source: Public Records
Tax History
| Year | Tax Paid | Tax Assessment Tax Assessment Total Assessment is a certain percentage of the fair market value that is determined by local assessors to be the total taxable value of land and additions on the property. | Land | Improvement |
|---|---|---|---|---|
| 2025 | $11,604 | $1,002,100 | $353,000 | $649,100 |
| 2024 | $10,538 | $966,800 | $366,300 | $600,500 |
| 2023 | $9,616 | $895,300 | $339,200 | $556,100 |
| 2022 | $9,276 | $852,600 | $323,000 | $529,600 |
| 2021 | $9,097 | $852,600 | $323,000 | $529,600 |
| 2020 | $8,900 | $842,800 | $286,600 | $556,200 |
| 2019 | $8,625 | $818,300 | $231,700 | $586,600 |
| 2018 | $8,011 | $764,400 | $231,700 | $532,700 |
| 2017 | $7,937 | $749,500 | $231,700 | $517,800 |
| 2016 | $7,494 | $681,300 | $231,700 | $449,600 |
| 2015 | $6,924 | $571,800 | $205,100 | $366,700 |
| 2014 | $6,349 | $504,700 | $205,100 | $299,600 |
Source: Public Records
Map
Nearby Homes
- 144 Newton St Unit 1
- 99 Tremont St Unit 206
- 99 Tremont St Unit 513
- 143 Tremont St Unit d
- 143 Tremont St Unit 2
- 12 Bigelow Cir Unit 2
- 12 Bigelow Cir Unit 3
- 16 Breck Ave Unit 18
- 11 Ricker Terrace Unit 1
- 48 Hardwick Terrace
- 21 Upcrest Rd
- 96 Brayton Rd
- 70 Washington St
- 70 Washington St Unit 70
- 26-28 Newton St
- 27 S Crescent Circuit Crescent
- 29-31 Hobson St
- 9 Oliva Rd
- 34 Larch St Unit 34
- 32 Larch St Unit 34
- 23 Matchett St
- 23 Matchett St Unit 2
- 23 Matchett St Unit 1
- 27 Matchett St
- 27 Matchett St Unit 1
- 19 Matchett St
- 31 Matchett St
- 31 Matchett St Unit 2
- 31 Matchett St Unit 1
- 24 Matchett St
- 24 Matchett St Unit 2
- 24 Matchett St
- 24 Matchett St Unit 2E
- 24 Matchett St Unit 1
- 20 Matchett St
- 20 Matchett St
- 20 Matchett St Unit 1
- 41 Hunnewell Ave Unit 1
- 41 Hunnewell Ave
- 41 Hunnewell Ave Unit 2
Your Personal Tour Guide
Ask me questions while you tour the home.