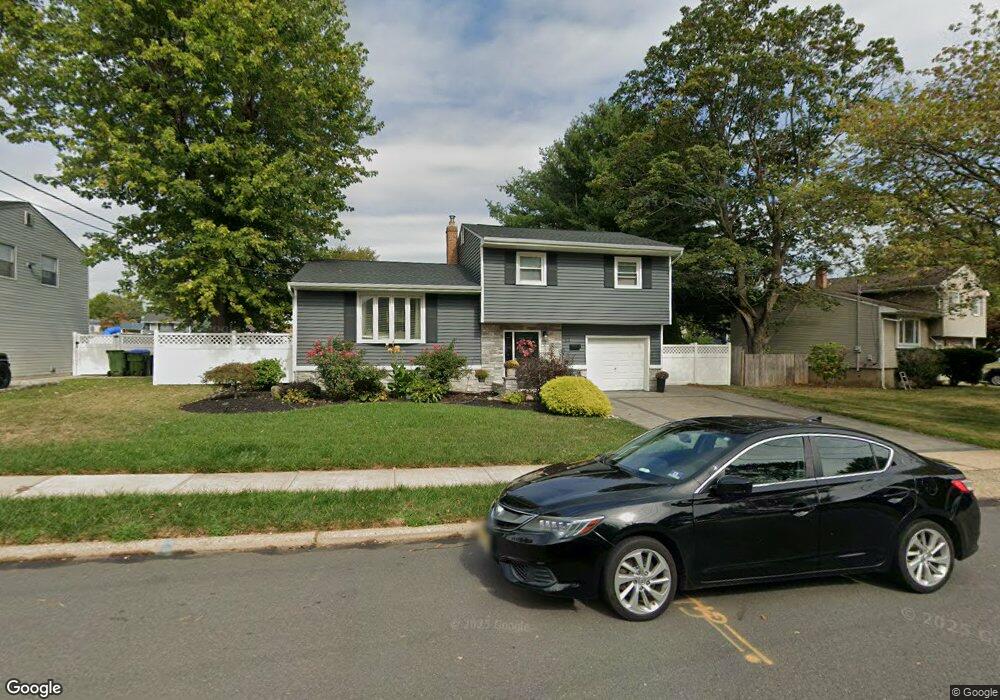
23 Moryan Rd Edison, NJ 08817
Estimated Value: $543,545 - $618,000
3
Beds
2
Baths
1,498
Sq Ft
$394/Sq Ft
Est. Value
About This Home
This home is located at 23 Moryan Rd, Edison, NJ 08817 and is currently estimated at $590,136, approximately $393 per square foot. 23 Moryan Rd is a home located in Middlesex County with nearby schools including Lincoln Elementary School, Herbert Hoover Middle School, and Edison High School.
Ownership History
Date
Name
Owned For
Owner Type
Purchase Details
Closed on
Oct 15, 2015
Sold by
Keil Eric and Toro Judy
Bought by
Hamafari Lordina
Current Estimated Value
Home Financials for this Owner
Home Financials are based on the most recent Mortgage that was taken out on this home.
Original Mortgage
$280,250
Outstanding Balance
$220,423
Interest Rate
3.87%
Mortgage Type
New Conventional
Estimated Equity
$369,713
Purchase Details
Closed on
Apr 30, 2001
Sold by
Carrano Thomas
Bought by
Keil Eric and Toro Judy
Create a Home Valuation Report for This Property
The Home Valuation Report is an in-depth analysis detailing your home's value as well as a comparison with similar homes in the area
Home Values in the Area
Average Home Value in this Area
Purchase History
| Date | Buyer | Sale Price | Title Company |
|---|---|---|---|
| Hamafari Lordina | $295,000 | Old Republic National Title | |
| Keil Eric | $197,000 | -- |
Source: Public Records
Mortgage History
| Date | Status | Borrower | Loan Amount |
|---|---|---|---|
| Open | Hamafari Lordina | $280,250 | |
| Closed | Keil Eric | $0 |
Source: Public Records
Tax History
| Year | Tax Paid | Tax Assessment Tax Assessment Total Assessment is a certain percentage of the fair market value that is determined by local assessors to be the total taxable value of land and additions on the property. | Land | Improvement |
|---|---|---|---|---|
| 2025 | $8,251 | $138,600 | $91,300 | $47,300 |
| 2024 | $8,207 | $138,600 | $91,300 | $47,300 |
| 2023 | $8,207 | $138,600 | $91,300 | $47,300 |
| 2022 | $8,209 | $138,600 | $91,300 | $47,300 |
| 2021 | $8,182 | $138,600 | $91,300 | $47,300 |
| 2020 | $8,107 | $138,600 | $91,300 | $47,300 |
| 2019 | $7,191 | $138,600 | $91,300 | $47,300 |
| 2018 | $8,336 | $154,300 | $91,300 | $63,000 |
| 2017 | $8,258 | $154,300 | $91,300 | $63,000 |
| 2016 | $8,014 | $151,900 | $91,300 | $60,600 |
| 2015 | $7,707 | $151,900 | $91,300 | $60,600 |
| 2014 | $7,483 | $151,900 | $91,300 | $60,600 |
Source: Public Records
Map
Nearby Homes
Your Personal Tour Guide
Ask me questions while you tour the home.