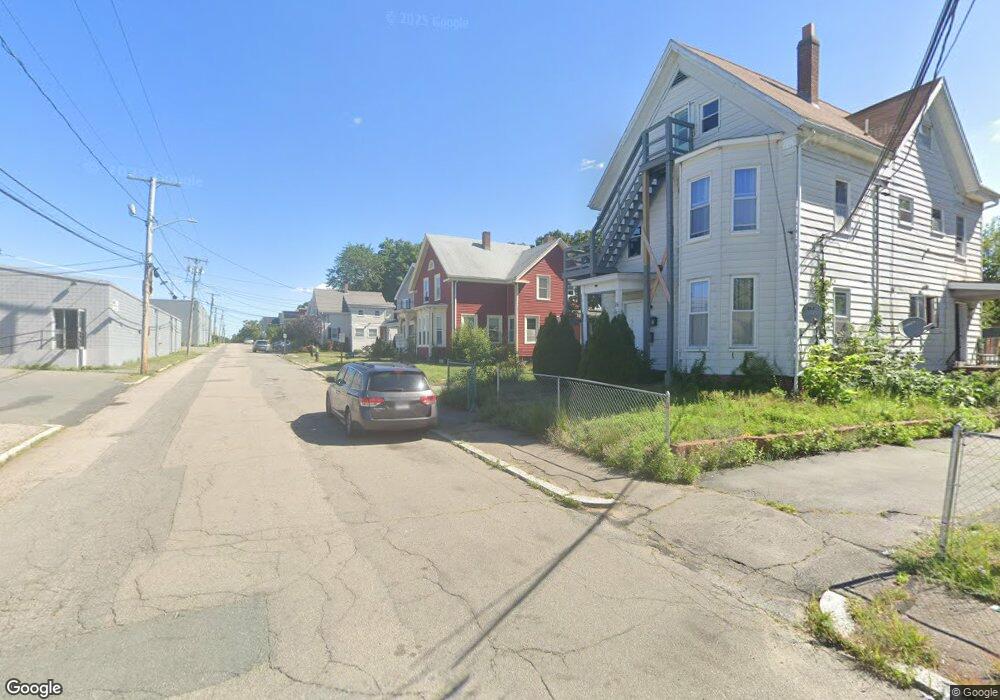
23 Mulberry St Brockton, MA 02302
Estimated Value: $473,463 - $611,000
4
Beds
2
Baths
1,850
Sq Ft
$306/Sq Ft
Est. Value
About This Home
This home is located at 23 Mulberry St, Brockton, MA 02302 and is currently estimated at $565,866, approximately $305 per square foot. 23 Mulberry St is a home located in Plymouth County with nearby schools including Brookfield Elementary School, Mary E. Baker Elementary School, and Downey Elementary School.
Ownership History
Date
Name
Owned For
Owner Type
Purchase Details
Closed on
Dec 31, 2001
Sold by
Wallace Dominique R
Bought by
Williams Cynthia
Current Estimated Value
Purchase Details
Closed on
Oct 1, 1999
Sold by
Jacobson Arthur A and Jacobson Lorraine A
Bought by
Wallace Dominique R
Create a Home Valuation Report for This Property
The Home Valuation Report is an in-depth analysis detailing your home's value as well as a comparison with similar homes in the area
Purchase History
| Date | Buyer | Sale Price | Title Company |
|---|---|---|---|
| Williams Cynthia | $179,000 | -- | |
| Wallace Dominique R | $128,000 | -- |
Source: Public Records
Mortgage History
| Date | Status | Borrower | Loan Amount |
|---|---|---|---|
| Open | Wallace Dominique R | $281,855 | |
| Closed | Wallace Dominique R | $252,000 | |
| Closed | Wallace Dominique R | $220,000 |
Source: Public Records
Tax History
| Year | Tax Paid | Tax Assessment Tax Assessment Total Assessment is a certain percentage of the fair market value that is determined by local assessors to be the total taxable value of land and additions on the property. | Land | Improvement |
|---|---|---|---|---|
| 2025 | $6,415 | $529,700 | $140,600 | $389,100 |
| 2024 | $6,002 | $499,300 | $140,600 | $358,700 |
| 2023 | $5,770 | $444,500 | $106,900 | $337,600 |
| 2022 | $6,073 | $434,700 | $97,200 | $337,500 |
| 2021 | $5,317 | $366,700 | $81,300 | $285,400 |
| 2020 | $4,713 | $311,100 | $75,600 | $235,500 |
| 2019 | $4,735 | $304,700 | $73,600 | $231,100 |
| 2018 | $4,256 | $265,000 | $73,600 | $191,400 |
| 2017 | $3,883 | $241,200 | $73,600 | $167,600 |
| 2016 | $3,656 | $210,600 | $71,500 | $139,100 |
| 2015 | $2,968 | $163,500 | $71,500 | $92,000 |
| 2014 | $2,930 | $161,600 | $71,500 | $90,100 |
Source: Public Records
Map
Nearby Homes
- 30 Elliot St
- 11 Carter St
- 166 Elliot St
- 65 E Ashland St
- 12 Charles St
- 0 Prospect St
- 28 Prospect St
- 136 E Ashland St
- 146 Court St Unit 604
- 150 E Ashland St
- 39 Huntington St
- 37 Taber Ave
- 29 Hunt St
- 35 Sylvester St
- 7 Main St Unit 203
- 560 N Montello St
- 97 Huntington St
- 18 Walnut St
- 147 Centre St Unit 603
- 34 Cherry St
- 15 Mulberry St
- 27 Mulberry St
- 9 Mulberry St
- 14 Emmet St
- 18 Emmet St
- 22 Emmet St
- 24 Emmet St Unit 1
- 24 Emmet St
- 33 Mulberry St
- 86 Elliot St
- 28 Emmet St
- 28 Emmet St Unit 3
- 28 Emmet St Unit 1
- 78 Elliot St
- 16 Emmet St
- 35 Mulberry St
- 92 Elliot St
- 92 Elliot St Unit 92 Elliot st Unit 3
- 92 Elliot St Unit 3
- 92 Elliot St Unit 1
Your Personal Tour Guide
Ask me questions while you tour the home.