23 Roach St Quincy, MA 02169
Germantown NeighborhoodEstimated Value: $586,000 - $642,667
About This Home
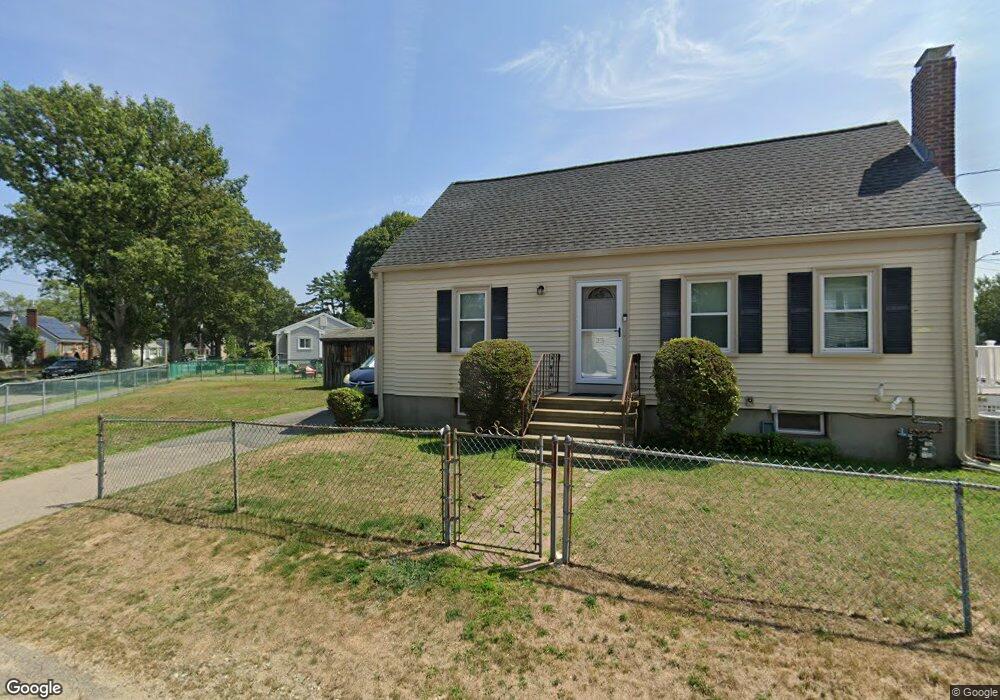
This home is located at 23 Roach St, Quincy, MA 02169 and is currently estimated at $613,667, approximately $405 per square foot. 23 Roach St is a home located in Norfolk County with nearby schools including Snug Harbor Community School, Broad Meadows Middle School, and Quincy High School.
Ownership History
We collect this data history from publicly available records. To have your information removed, we recommend requesting removal directly through your county’s website.
Purchase Details
Purchase Details
Home Financials for this Owner
Home Financials are based on the most recent Mortgage that was taken out on this home.Home Values in the Area
Average Home Value in this Area
Purchase History
We collect this data history from publicly available records. To have your information removed, we recommend requesting removal directly through your county’s website.
| Date | Buyer | Sale Price | Title Company |
|---|---|---|---|
| -- | -- | ||
| $130,000 | -- |
Mortgage History
We collect this data history from publicly available records. To have your information removed, we recommend requesting removal directly through your county’s website.
| Date | Status | Borrower | Loan Amount |
|---|---|---|---|
| Previous Owner | $104,000 | ||
| Previous Owner | $100,000 | ||
| Previous Owner | $118,400 |
Tax History
We collect this data history from publicly available records. To have your information removed, we recommend requesting removal directly through your county’s website.
| Year | Tax Paid | Tax Assessment Tax Assessment Total Assessment is a certain percentage of the fair market value that is determined by local assessors to be the total taxable value of land and additions on the property. | Land | Improvement |
|---|---|---|---|---|
| 2025 | $6,105 | $529,500 | $220,100 | $309,400 |
| 2024 | $5,938 | $526,900 | $220,100 | $306,800 |
| 2023 | $5,421 | $487,100 | $200,100 | $287,000 |
| 2022 | $5,162 | $430,900 | $153,900 | $277,000 |
| 2021 | $4,866 | $400,800 | $133,900 | $266,900 |
| 2020 | $5,074 | $408,200 | $148,700 | $259,500 |
| 2019 | $4,590 | $365,700 | $136,400 | $229,300 |
| 2018 | $4,674 | $350,400 | $129,900 | $220,500 |
| 2017 | $4,335 | $305,900 | $118,100 | $187,800 |
| 2016 | $4,401 | $306,500 | $131,200 | $175,300 |
| 2015 | $4,227 | $289,500 | $119,300 | $170,200 |
| 2014 | $3,789 | $255,000 | $108,500 | $146,500 |
Map
- 5 Northfield Ave
- 108 Palmer St
- 599 Sea St Unit 2
- 173 Rhoda St
- 576 Sea St
- 84 Post Island Rd
- 18 Allerton St
- 706 Sea St
- 14 Palmer St
- 716 Sea St
- 30 Hooper St
- 200 Cove Way Unit 311
- 200 Cove Way Unit 113
- 200 Cove Way Unit 909
- 815 Sea St
- 93 Baxter Ave
- 90 Lawn Ave
- 100 Cove Way Unit 409
- 100 Cove Way Unit 402
- 358 Rock Island Rd
Ask me questions while you tour the home.