23 Stephen St Montclair, NJ 07042
Montclair AreaEstimated Value: $1,197,000 - $1,474,000
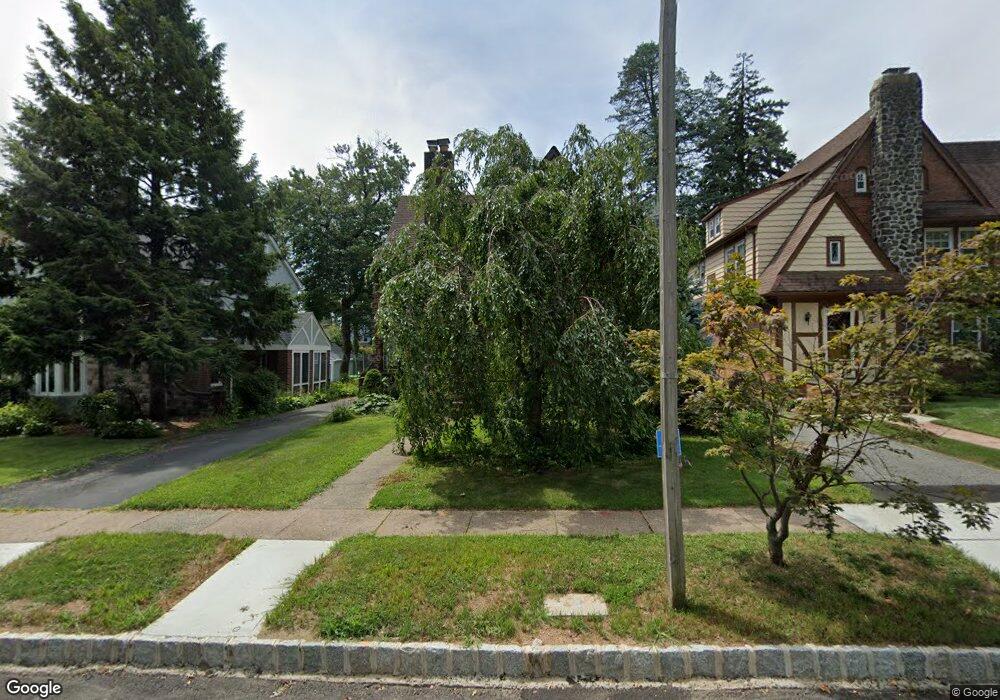
About This Home
This home is located at 23 Stephen St, Montclair, NJ 07042 and is currently estimated at $1,348,291, approximately $603 per square foot. 23 Stephen St is a home located in Essex County with nearby schools including Nishuane School, Bradford School, and Hillside School.
Ownership History
We collect this data history from publicly available records. To have your information removed, we recommend requesting removal directly through your county’s website.
Purchase Details
Home Financials for this Owner
Home Financials are based on the most recent Mortgage that was taken out on this home.Purchase Details
Home Financials for this Owner
Home Financials are based on the most recent Mortgage that was taken out on this home.Home Values in the Area
Average Home Value in this Area
Purchase History
We collect this data history from publicly available records. To have your information removed, we recommend requesting removal directly through your county’s website.
| Date | Buyer | Sale Price | Title Company |
|---|---|---|---|
| $765,000 | None Available | ||
| $630,000 | -- |
Mortgage History
We collect this data history from publicly available records. To have your information removed, we recommend requesting removal directly through your county’s website.
| Date | Status | Borrower | Loan Amount |
|---|---|---|---|
| Closed | $688,500 | ||
| Previous Owner | $504,000 |
Tax History
We collect this data history from publicly available records. To have your information removed, we recommend requesting removal directly through your county’s website.
| Year | Tax Paid | Tax Assessment Tax Assessment Total Assessment is a certain percentage of the fair market value that is determined by local assessors to be the total taxable value of land and additions on the property. | Land | Improvement |
|---|---|---|---|---|
| 2026 | $24,264 | $690,100 | $340,600 | $349,500 |
| 2025 | $24,264 | $690,100 | $340,600 | $349,500 |
| 2024 | $23,325 | $690,100 | $340,600 | $349,500 |
| 2022 | $22,690 | $690,100 | $340,600 | $349,500 |
| 2021 | $22,297 | $690,100 | $340,600 | $349,500 |
| 2020 | $21,938 | $690,100 | $340,600 | $349,500 |
| 2019 | $21,711 | $690,100 | $340,600 | $349,500 |
| 2018 | $21,352 | $690,100 | $340,600 | $349,500 |
| 2017 | $22,128 | $592,600 | $300,600 | $292,000 |
| 2016 | $21,255 | $584,900 | $300,600 | $284,300 |
| 2015 | $20,624 | $584,900 | $300,600 | $284,300 |
| 2014 | $19,933 | $584,900 | $300,600 | $284,300 |
Map
- 14 Gray St
- 51 Gray St
- 33 Prescott Ave
- 3 Christopher Ct
- 202 Watchung Ave
- 200 Grove St
- 39 Essex Ave
- 786 Broad St
- 33 Yantecaw Ave
- 10 Reid Ave
- 56 Eaton Place
- 367 Essex Ave
- 997 Broad St
- 265 Park St
- 197 N Fullerton Ave
- 195 N Fullerton Ave Unit A
- 54 Aubrey Rd
- 935 Broad St Unit 35B
- 935 Broad St
- 42 Johnson Ave
Ask me questions while you tour the home.