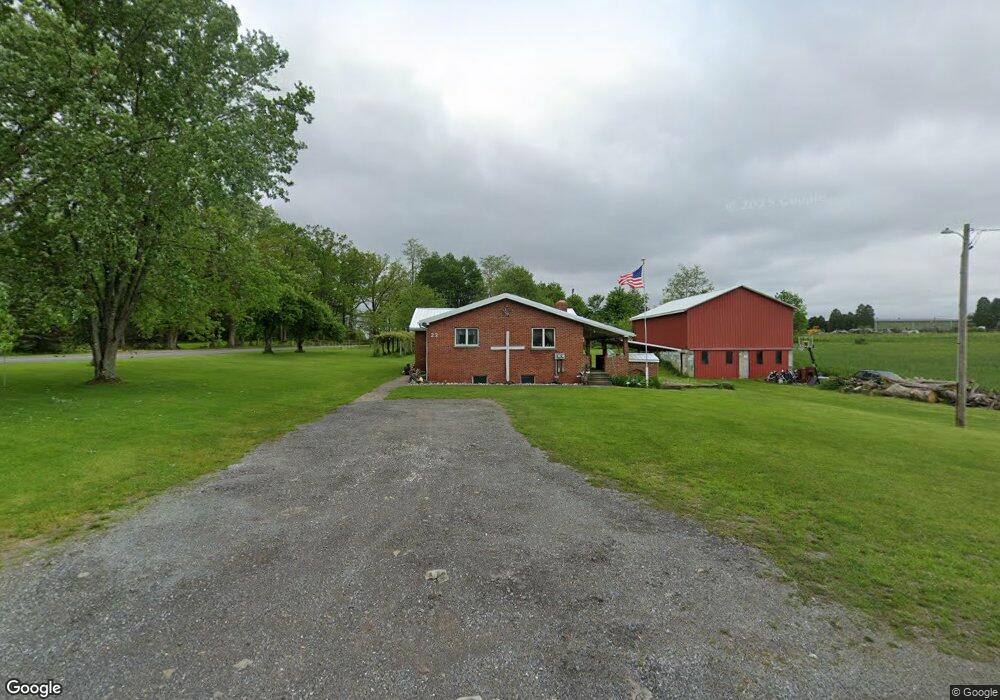
23 Sycamore Rd Cherry Tree, PA 15724
Estimated Value: $108,000 - $318,000
4
Beds
1
Bath
1,490
Sq Ft
$136/Sq Ft
Est. Value
About This Home
This home is located at 23 Sycamore Rd, Cherry Tree, PA 15724 and is currently estimated at $202,286, approximately $135 per square foot. 23 Sycamore Rd is a home located in Indiana County with nearby schools including Purchase Line Elementary School, Purchase Line Junior/Senior High School, and Rocky Ridge Amish School.
Create a Home Valuation Report for This Property
The Home Valuation Report is an in-depth analysis detailing your home's value as well as a comparison with similar homes in the area
Tax History
| Year | Tax Paid | Tax Assessment Tax Assessment Total Assessment is a certain percentage of the fair market value that is determined by local assessors to be the total taxable value of land and additions on the property. | Land | Improvement |
|---|---|---|---|---|
| 2025 | $2,320 | $140,400 | $23,100 | $117,300 |
| 2024 | $2,217 | $140,400 | $23,100 | $117,300 |
| 2023 | $12,787 | $140,400 | $23,100 | $117,300 |
| 2022 | $1,969 | $140,400 | $23,100 | $117,300 |
| 2021 | $1,969 | $140,400 | $23,100 | $117,300 |
| 2020 | $1,906 | $140,400 | $23,100 | $117,300 |
| 2018 | $11,781 | $140,400 | $23,100 | $117,300 |
| 2017 | $3,439 | $140,400 | $23,100 | $117,300 |
| 2016 | -- | $140,400 | $23,100 | $117,300 |
| 2015 | -- | $13,290 | $1,120 | $12,170 |
| 2014 | -- | $13,290 | $1,120 | $12,170 |
Source: Public Records
Map
Nearby Homes
- 3233 Cookport Rd
- 1427 Route 580 Hwy
- 000 Williams Ave
- 000 Rte 553 Hwy E
- 7703 Route 553 Hwy
- 00 Black Walnut Rd
- 660 Swamp Rd
- 3246 Killen School Rd
- 2372 Smith St
- 0 Wise Ln Unit 1714499
- 00 Maple Ave
- 106 Pine St
- 172 Pine St
- 151 Hemlock Rd
- 408 Sycamore St
- 2009 Philadelphia Ave
- 4053 Pioneer Lake Rd
- 1404 Park Ave
- 213 Laurel St
- 5077 Purchase Line Rd
- 4156 Route 580 Hwy
- 4156 Route 580 Hwy
- 4210 Route 580 Hwy
- 4299 Route 580 Hwy
- 4302 Route 580 Hwy
- 4356 Route 580 Hwy
- 3987 Route 580 Hwy
- 309 Sycamore Rd
- 370 Sycamore Rd
- 3901 Route 580 Hwy
- 4486 Route 580 Hwy
- 4486 Route 580 Hwy
- 3843 Route 580 Hwy
- 4629 Route 580 Hwy
- 2064 Valley Rd
- 3658 Route 580 Hwy
- 245 Pine Run Ln
- 2209 Spruce Rd
- 100 Pine Run Ln
- 2405 Valley Rd
Your Personal Tour Guide
Ask me questions while you tour the home.